R-DIAG
Overview

R-DIAG (Realtek Diagnostics) manages events from various modules through predefined event types and structured data bodies, and provides two interfaces for host computers to retrieve event data:
Local Interface: Based on physical interfaces (e.g. LOGUART), suitable for on-site debugging and quick data acquisition.
Network Interface: Based on network protocols (e.g. TCP/UDP), suitable for remote diagnostics, multi-device concurrent access, and cloud integration.
Workflow
The event recording and parsing process through R-DIAG is as follows:

Event Structure Definition and Recording: Define event types and data structures in SDK, then call APIs to log events in code.
Configuration File Generation: Automatically generate JSON-format structure description files and version verification information during compilation.
Event Recording: Record event data during runtime after firmware flashed.
Event Retrieval: Host computer reads event data through the provided interfaces.
Event Parsing: Host computer parses and displays event details using the JSON file.
Capabilities and Extensions
Default support for event logging in Wi-Fi, I2C, DMA modules (e.g. Wi-Fi disconnection reasons, connection failure causes). For custom events, refer to Custom Event Addition.
Default event acquisition and parsing via local LOGUART. Usage details: Local R-DIAG.
For remote acquisition/parsing via TCP/UDP protocols, see implementation example Remote R-DIAG Demo. For custom tool development, refer to Remote R-DIAG Development.
Feature Enablement
To enable/disable R-DIAG feature:
Set up the compilation environment
Run
ameba.py menuconfigto enter the configuration interfaceModify option
Note
R-DIAG is disabled by default.
Local R-DIAG
The SDK natively supports using Realtek’s serial debugging tool Trace Tool (v2.1.38+) to acquire and parse events via LOGUART. For tool documentation, see Log Tool . The usage steps for R-DIAG feature are as follows:
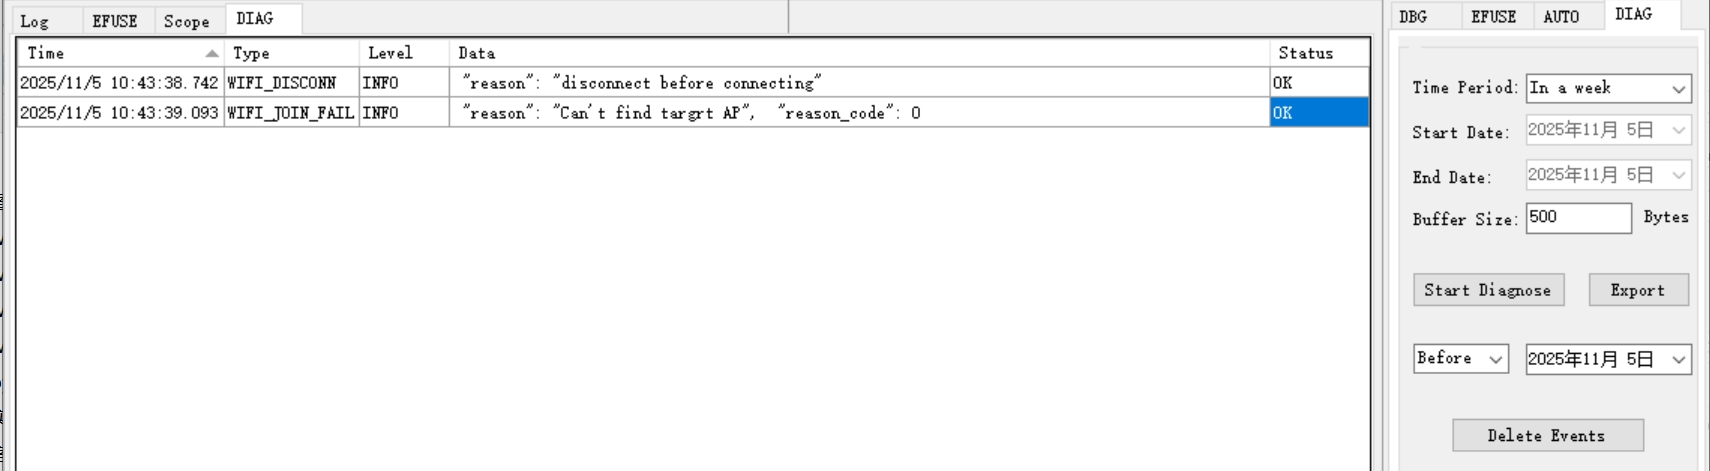
Configure parameters in the DIAG tab:
Time Period: Time range for data retrieval, default: “In a week”
Start Date / End Date: Required to set start and end times manually when Time Period is set to “Custom options”
Buffer Size: Buffer size per retrieval, default: 500 bytes
Click Start Diagnose to start retrieving events. Parsed results will display on the left panel.
Click Export to save records as an Excel file in
/TraceTool/DiagnoseInfoExport
Custom Event Addition
The steps to add custom events in {SDK}/component/soc/common/diagnose/ameba_diagnose_customer.h are as follows:
Define Event ID
Name events using the format DIAG_EVT_CUSTOMER_{EventName} with RTK_EVENT_TYPE_CUSTOMER as the base address. Example:
enum diag_evt_customer {
    DIAG_EVT_CUSTOMER_DEMO = RTK_EVENT_TYPE_CUSTOMER + 0x01,
    ...
};
Define Event Structure
Naming Rule: Use lowercase of the event ID enum name. Example: DIAG_EVT_CUSTOMER_DEMO corresponds to struct diag_evt_customer_demo.
Memory Alignment: Use __PACKED attribute.
Variable Definition Rules:
Comment Requirements:
Parser-oriented comments must use
/* <!-- DIAG: --> xxxxx*/, placed at the end of the variable definition line, and must not span lines.Example:
struct diag_evt_customer_demo {
    u16 reason;     /* <!-- DIAG: --> enum customer_demo_reason in customer_demo_types.h */
    u32 timestamp;  /* <!-- DIAG: --> UNIX time in seconds */ // os tick value
} __PACKED;
Generated JSON:
"diag_evt_customer_demo": {
  "reason": {
    "type": "u16",
    "enum_ref": "customer_demo_reason",
    "comment": "enum customer_demo_reason in customer_demo_types.h"
  },
  "timestamp": {
    "type": "u32",
    "comment": "UNIX time in seconds"
  }
},
Avoid Direct Enum Usage:
Use base integer types according to the enum value range.
Comments must specify the enum type and its definition file using the format
/* <!-- DIAG: --> enum xxxxx in filexxxxx.h */to facilitate tool-based parsing.Example: The reason field in diag_evt_customer_demo actually uses the enum defined as follows:
enum customer_demo_reason {
    CUSTOMER_DEMO_RSN_UNKNOWN   = 10001, /* <!-- DIAG: --> unknown */
    CUSTOMER_DEMO_RSN_TIMEOUT   = 10002, /* <!-- DIAG: --> timeout occurred */
    CUSTOMER_DEMO_RSN_THRESHOLD = 10003, /* <!-- DIAG: --> threshold exceeded */
};
Generated JSON mapping:
"customer_demo_reason": {
    "unknown": 10001,
    "timeout occurred": 10002,
    "threshold exceeded": 10003
},
Structure Nesting: not exceed 3 levels
String Fields: Use
chartypeBitfields: Only support
u8,u16,u32; if less than 1 byte, add padding
Log Events
Event Levels:
enum rtk_event_level {
    RTK_EVENT_LEVEL_ALWAYS = 0,
    RTK_EVENT_LEVEL_ERROR,
    RTK_EVENT_LEVEL_WARNING,
    RTK_EVENT_LEVEL_INFO,
    RTK_EVENT_LEVEL_DEBUG,
};
API Calls: Use level-specific APIs with three parameters: event type ID, struct address, and length.
RTK_EVENT_A(_type, _info, _len)  // ALWAYS
RTK_EVENT_E(_type, _info, _len)  // ERROR
RTK_EVENT_W(_type, _info, _len)  // WARNING
RTK_EVENT_I(_type, _info, _len)  // INFO
RTK_EVENT_D(_type, _info, _len)  // DEBUG
Example (Logging an INFO-level event in a “customer demo trigger” handler):
void customer_demo_trigger_handler(void)
{
    struct diag_evt_customer_demo event_data = {
        .reason    = 10002,   /* triggered by timeout */
        .timestamp = 1731580000U
    };

    RTK_EVENT_I(DIAG_EVT_CUSTOMER_DEMO, (u8 *)&event_data, sizeof(event_data));
 }
Update JSON Configuration
Update the host tool’s configuration file to the compile-generated {SDK}/component/soc/common/diagnose/ameba_diagnose_format_full.json to avoid parsing errors.
For Local R-DIAG, update to /TraceTool/DiagnoseProfiles.
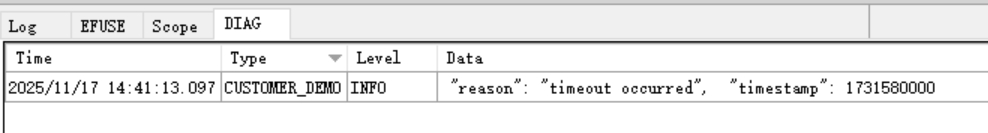
Event Parsing Demo
After adding the DIAG_EVT_CUSTOMER_DEMO example, the parsing result using Local R-DIAG:
Remote R-DIAG Demo
This example demonstrates collecting and parsing diagnostic events between a PC and an Ameba device via MQTT.
SDK example path:
{SDK}/example/wifi/wifi_diagnose_mqttPC tool path:
{SDK}/tools/ameba/R-DIAG_Demo_Tool
Environment and Network Topology

Raspberry Pi (with Mosquitto server/client installed) acts as MQTT Broker
PC acts as the host, running the event collection/parsing tool
Ameba runs example firmware to generate and send events via MQTT
All devices must connect to the same AP
Confirm Raspberry Pi’s IPv4 address before use (for Ameba and PC configuration below)
Topic conventions:
request_diag_events: PC publishes requests; Ameba subscribesresponse_diag_events: Ameba publishes responses; PC subscribes
Note
Raspberry Pi is only an example MQTT Broker environment. Alternatives include:
Cloud servers (public/private)
Virtual machines (VMware/VirtualBox)
Linux-based PCs
Ensure replacements meet:
MQTT Broker is installed and running with accessible listening address/port
Ameba and PC can route to the Broker. If not on the same AP/subnet, ensure cross-subnet or public reachability, and configure port forwarding, firewall rules, and DNS resolution as needed
Quick Start
Obtain Raspberry Pi’s IPv4 address on the current AP (e.g.,
192.168.1.106)Device Configuration (Ameba example):
Update MQTT Broker address in
{SDK}/example/wifi/wifi_diagnose_mqtt/example_wifi_diagnose_mqtt.cto the Raspberry Pi IP:static const char *address = "192.168.1.106";
Build and Flash:
Execute:
ameba.py build -a wifi_diagnose_mqtt
Flash the firmware to the Ameba device following the standard procedure
PC Configuration:
Update Broker address in
R-DIAG_Demo_Tool/diagnose_defines.pyto the Raspberry Pi IP:MQTT_BROKER = "192.168.1.106"
Run PC Tool:
Navigate to
R-DIAG_Demo_Tooland execute:python diagnose_main.pyThe tool uses
WiFiDiagnoseServer.diag_read_events()to:Internally, it calls
DiagController.diag_read_backgroud_worker()to perform pre-read configuration (version hash check, time alignment, buffer setting, time range setting), then callsDiagController.get_diag_event()to fetch/parse Ameba’s events of the current day, and saves results as JSON files inR-DIAG_Demo_Tool/DiagnoseProfiles.
Adjust Time Range (Optional):
Modify input parameters of
WiFiDiagnoseServer.diag_read_events()indiagnose_main.pyto limit the device timestamp range to fetch.
Note
If version hash verification fails, update host PC’s JSON to match device
If PC cannot retrieve events, check:
MQTT Broker status (Raspberry Pi’s mosquitto service)
Broker firewall allows inbound traffic on MQTT port (default: 1883)
PC firewall allows outbound connections to Broker’s MQTT port
Client connection parameters (IP/port) match Broker settings
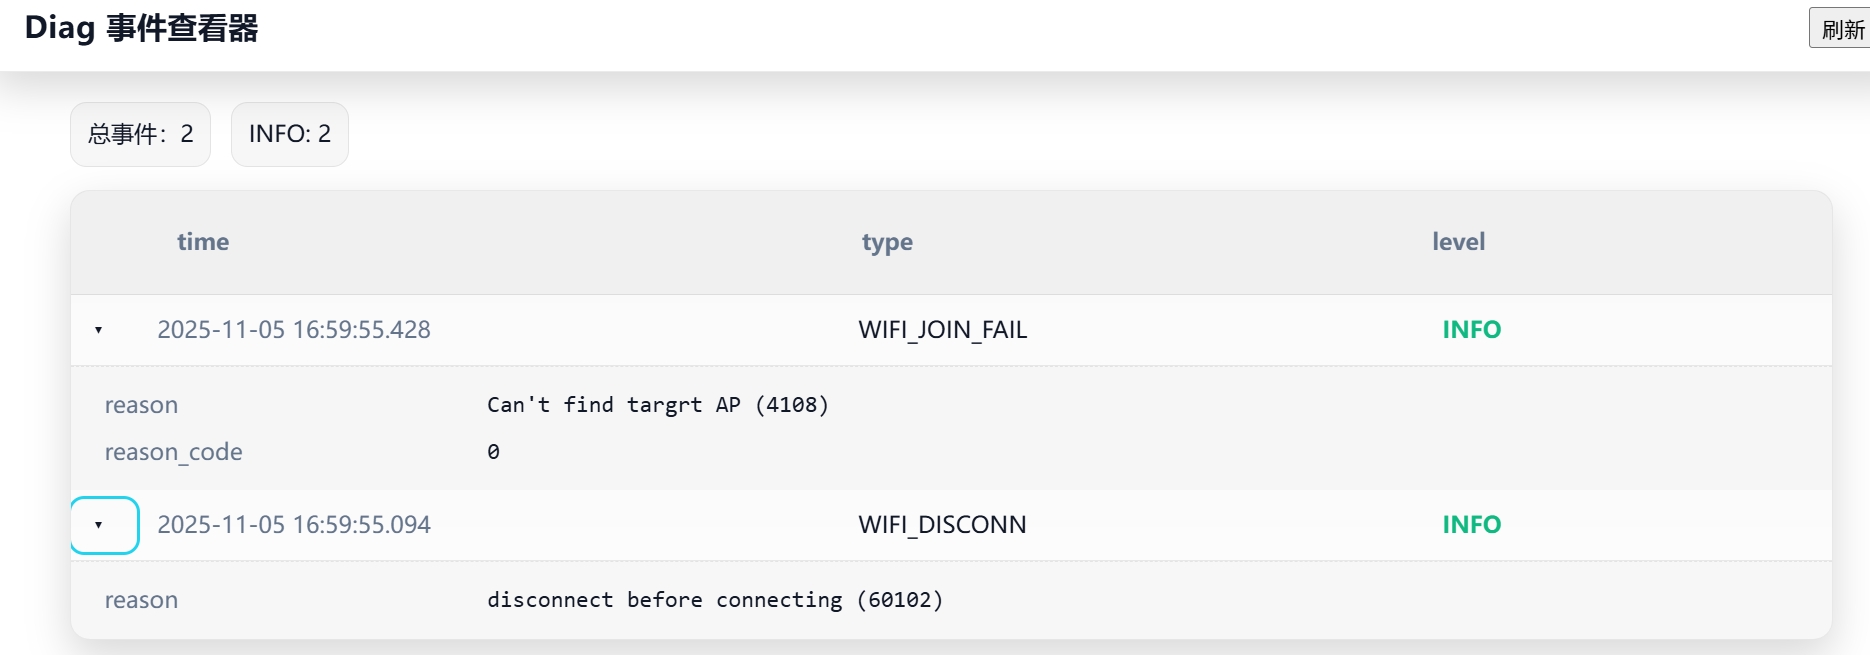
Result Visualization
Visualize generated JSON files in R-DIAG_Demo_Tool/DiagnoseProfiles. Simple example:
Remote R-DIAG Development
Device-Side Interface Configuration
To enable event data retrieval via network interfaces, the device-side SDK code must register an event data transmission interface to instruct the Diagnose component how to deliver event data:
int rtk_diag_config_transform(rtk_diag_sender_t sender, u8 *sender_buffer, u16 sender_buffer_size);
Item |
Description |
|---|---|
Function |
Configure the event data transmission interface |
Parameters |
sender: User-implemented event data transmission function with prototype: typedef int (*rtk_diag_sender_t)(const u8 *data, u16 len);
sender_buffer: Fixed transmission buffer used by Diagnose component to copy event data sender_buffer_size: Transmission buffer size in bytes |
Return |
0 indicates success, non-zero for error codes |
Notes |
|
Example |
See u8 diag_send_buf[1024] = {0};
int rtk_diag_mqtt_send(const u8 *data, u16 len);
static void prvMQTTTask(void *pvParameters)
{
...
rtk_diag_config_transform(rtk_diag_mqtt_send, diag_send_buf, 1024);
}
|
Host-Device Interaction Protocol
The host tool communicates with Ameba in request-response mode, where Ameba always responds passively. Complete workflow:

Pre-fetch Configuration
Hash Check: Verifies JSON version consistency between device and host to prevent parsing errors caused by struct definition changes
OS Timestamp Acquisition: Maps device timestamps to host real-time to resolve actual event time
Send Buffer Setup: Limits the maximum length per transfer to avoid impacting system scheduling
Event Retrieval Interaction
The host dynamically updates request parameters (time and offset) based on Ameba’s responses until:
No more events are available from the device
The host-defined time range is reached