LOG Tool
Resources
Introduction
Trace Tool is an official serial logging tool for the Ameba SoC series developed by Realtek. Through the LOGUART port, it allows developers to send commands to and receive logs from devices in real time.
Compared to generic serial port tools, Trace Tool offers the following advanced functionalities:
Multi-core AGG log parsing
When the LOGUART AGG (aggregation) feature is enabled, Trace Tool demultiplexes the interleaved logs of multiple cores and prepends a per-core tag (for example
[KM4]or[CA32]) to each log entry. The demultiplexing is dispatched automatically according to the selected SoC, so simply selecting the connected chip configures the correct per-core tags and the routing of every AGG path.BT log capture
Automatically captures Bluetooth host (upper-stack) logs and Bluetooth firmware logs to files.
Register access
Reads, writes, and dumps system and Wi-Fi (MAC/BB/RF) registers by address.
Scope
Plots numeric values parsed from specifically formatted logs as live waveforms.
Wi-Fi debugging
Supports access of WiFi-related registers and WiFi debugging.
Automation script
Runs a command script with loops, delays, and pass/fail pattern matching.
Note
If the above advanced features are not required, generic serial port tools can be used as alternatives to Trace Tool.
The UI of Trace Tool is shown below:
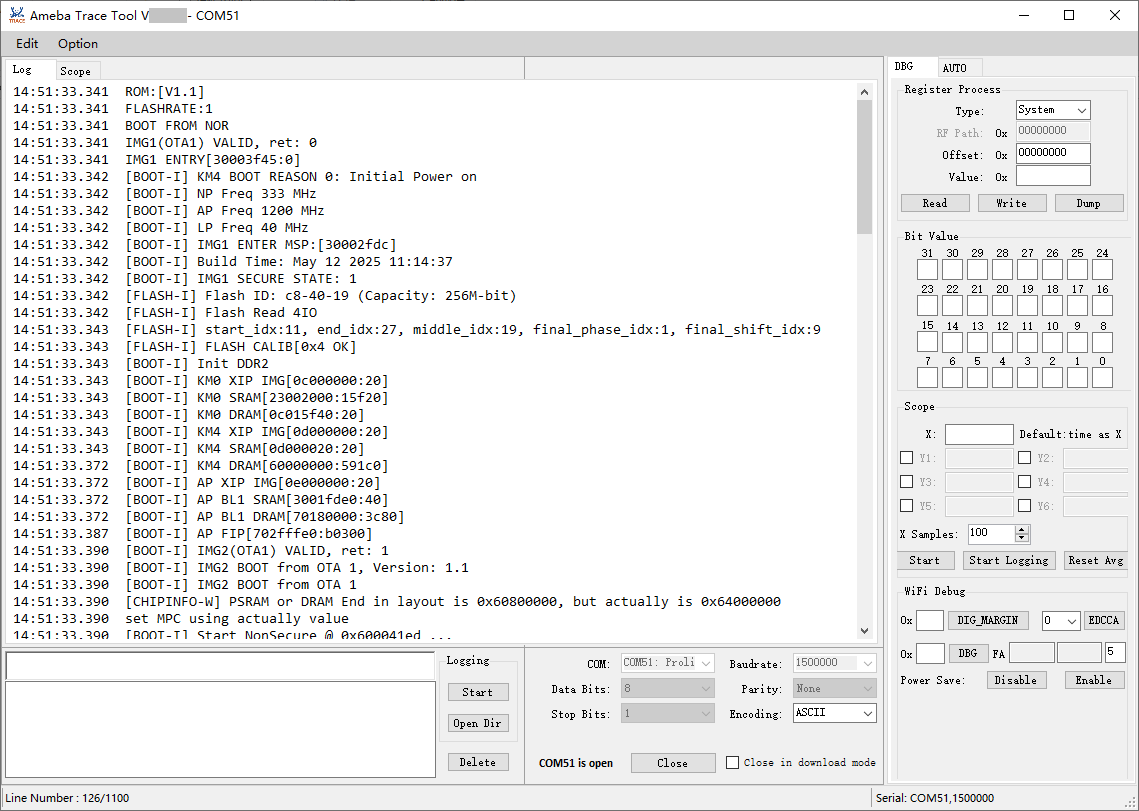
The menu bar provides the following items:
Chip(shown in red): Select the connected SoC. Refer to SoC Selection for details.Edit: ProvidesClear Log,Clear Auto Log, and theHistory Commandssubmenu (Clear/Save/Load) for managing the history command list.Option: ProvidesGlobal Settingsfor configuring the number of displayed lines, the log file size, and the timestamp display.
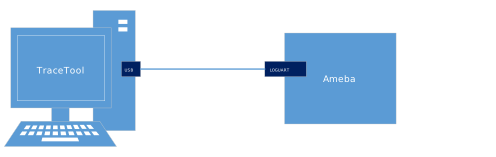
Hardware Connection
The hardware connection is illustrated below:
Software Setup
Environment requirements:
Windows XP or above
.NET Framework 4.6.1 or above
Software location:
{SDK}/tools/ameba/TraceTool/AmebaTraceTool.exe
Note
Install the driver for the USB-to-UART adapter (for example, PL2303GC) on the host first; otherwise, the host will not be able to recognize the LOGUART port.
Download the appropriate driver from the official website of the corresponding USB-to-UART adapter supplier.
SoC Selection
It is recommended to select the connected SoC from the Chip menu before opening the serial port. The selection is persisted and automatically restored on the next launch.
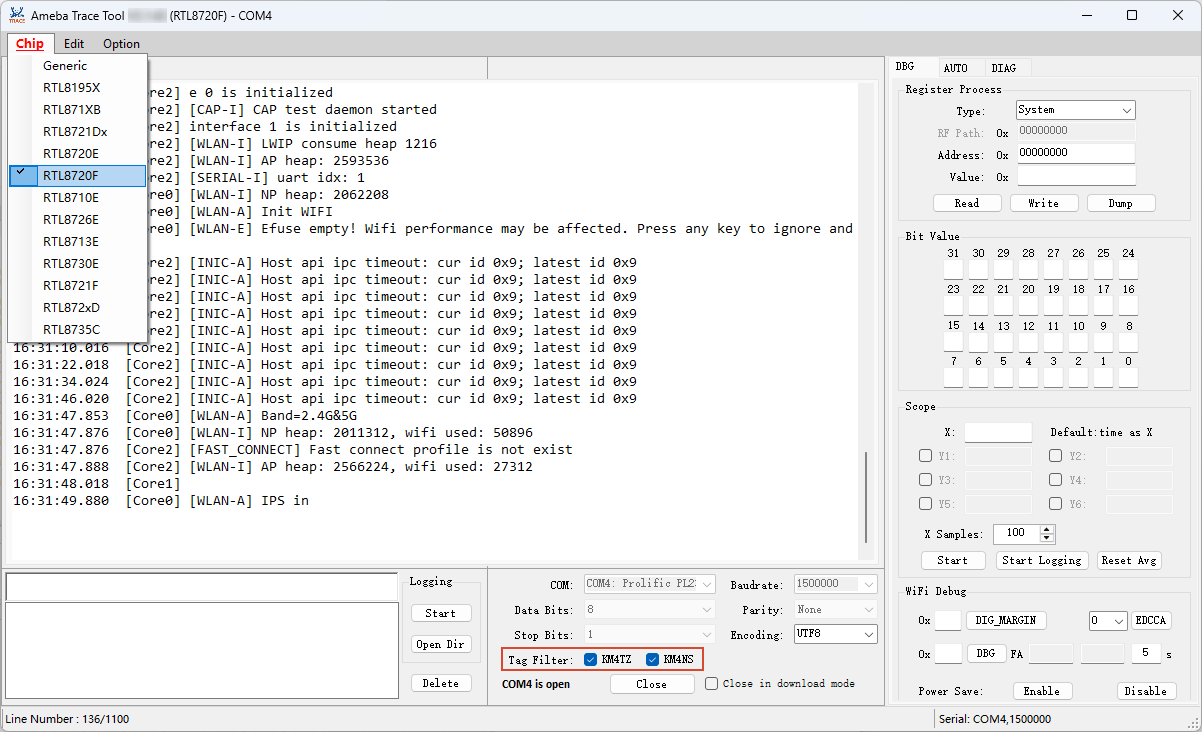
Trace Tool dispatches AGG logs based entirely on the selected SoC. Once the connected SoC is selected, the per-core tags, the Tag Filter entries, and the routing of each AGG path are configured automatically; no further manual setup is required.
The selected SoC determines:
the per-core tag prepended to each log line when LOGUART AGG is enabled;
the entries shown in the Tag Filter panel, which is used to show or hide individual cores;
how each AGG path is dispatched: text paths to the Log tab, and Bluetooth or other binary paths to capture files or TCP sockets. Refer to AGG Support for the per-SoC path mapping.
Note
Genericis the default selection. When the connected SoC is not selected, or an unrecognized path is received, Trace Tool falls back to the generic core tags[Core0]/[Core1]/[Core2]for text paths so that logs remain visible. Select the actual SoC to obtain the correct per-core tags.RTL872xD, RTL8195X, and RTL871XB are SoCs that do not support the AGG feature. Their LOGUART does not insert AGG headers, so no core tags are applied and the Tag Filter panel is hidden when these SoCs are selected.
Log Print
Basic Usage
After setting the environment mentioned in Section Hardware Connection, execute the following steps:
Select serial port in COM box.
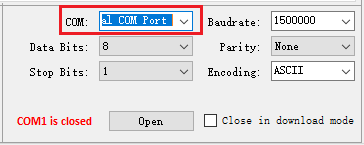
Configure the serial port.
Baudrate: The default value is 1500000bps.
Data Bits: The default value is 8.
Parity: The default value is “None”.
Stop Bits: The default value is 1.
Encoding: The default value is UTF-8, which displays multi-byte characters (such as Chinese) correctly. ASCII is also available.
These parameters must be consistent with the LOGUART settings on the device side.
Additionally, a Close in download mode checkbox is provided, when enabled, Trace Tool automatically closes the serial port upon detecting the SoC entering download mode.
Click the Open button to open the serial port and start to receive the logs from device.
Log messages will be printed on Log Tab and the text of Open button will be switched to Close.
To stop receiving the logs, click the Close button to close the serial port.
Log Saving
To save the logs to local file:
Click Start button in Logging box, all the received logs will be saved to the specified
.txtfile.
Note
For segmented logs, click Option and Global Settings to set the log size.
Click the Open Dir button in Logging box to open the folder where the log file are saved.
AGG Support
Trace Tool automatically detects whether the LOGUART AGG (aggregation) feature is enabled and processes logs accordingly.
AGG enabled
The firmware multiplexes the log streams of multiple cores over the single LOGUART pin, tagging every packet with a path number that identifies its source. Trace Tool parses the AGG header of each packet and automatically dispatches it according to the SoC selected in the
Chipmenu; no further manual configuration is required.Each AGG path carries the following core or stream on each SoC:
SoC
Path 1
Path 2
Path 3
Path 4
Path 5
RTL8721Dx
KM4
KM0
BT upper stack
—
BT FW
RTL8721F
KM4TZ
KM4NS
BT upper stack
—
BT FW
RTL8720F
KM4TZ
KM4NS
BT upper stack
SDN
—
RTL8720E
KM4
KR4
BT upper stack
—
BT FW
RTL8710E
KM4
KR4
BT upper stack
—
BT FW
RTL8726E
KM4
KR4
BT upper stack
DSP
BT FW
RTL8713E
KM4
KR4
BT upper stack
DSP
BT FW
RTL8730E
KM4
KM0
BT upper stack
CA32
BT FW
RTL8735C
KM4NP
CA32
BT upper stack
KM0
BT FW
Text logs are displayed in the Log tab, each prepended with the corresponding core tag (for example
[KM4]or[CA32]). To show or hide the logs of individual cores, check or uncheck the desired cores in the Tag Filter panel; the panel is rebuilt to list the cores of the selected SoC each time theChipselection changes.The other streams (BT upper stack, BT FW, and SDN) are binary and are not displayed in the Log tab. They are saved to a file with the corresponding file name, or relayed to a TCP socket:
Bluetooth host (upper-stack) logs are saved to a
BT_*.binfile, or relayed to a Bluetooth analyzer connected on TCP port5000.Bluetooth firmware logs are saved to a
BT_FW_*.logfile, or relayed on TCP port5001.SDN logs are saved to an
SDN_*.binfile.
When LOGUART AGG is enabled, other serial tools may display garbled text because they cannot parse AGG headers.
AGG disabled
Logs do not include AGG header information.
Trace Tool does not prepend core tags to log entries.
In this case:
Log entries may become mixed when multiple cores print simultaneously.
Users can use other serial tools to print logs if Bluetooth host and firmware logs are not required.
Note
By default, LOGUART AGG is disabled. To enable it, refer to User Configuration .
Temporary log display issues may occur when switching AGG between enabled and disabled states.
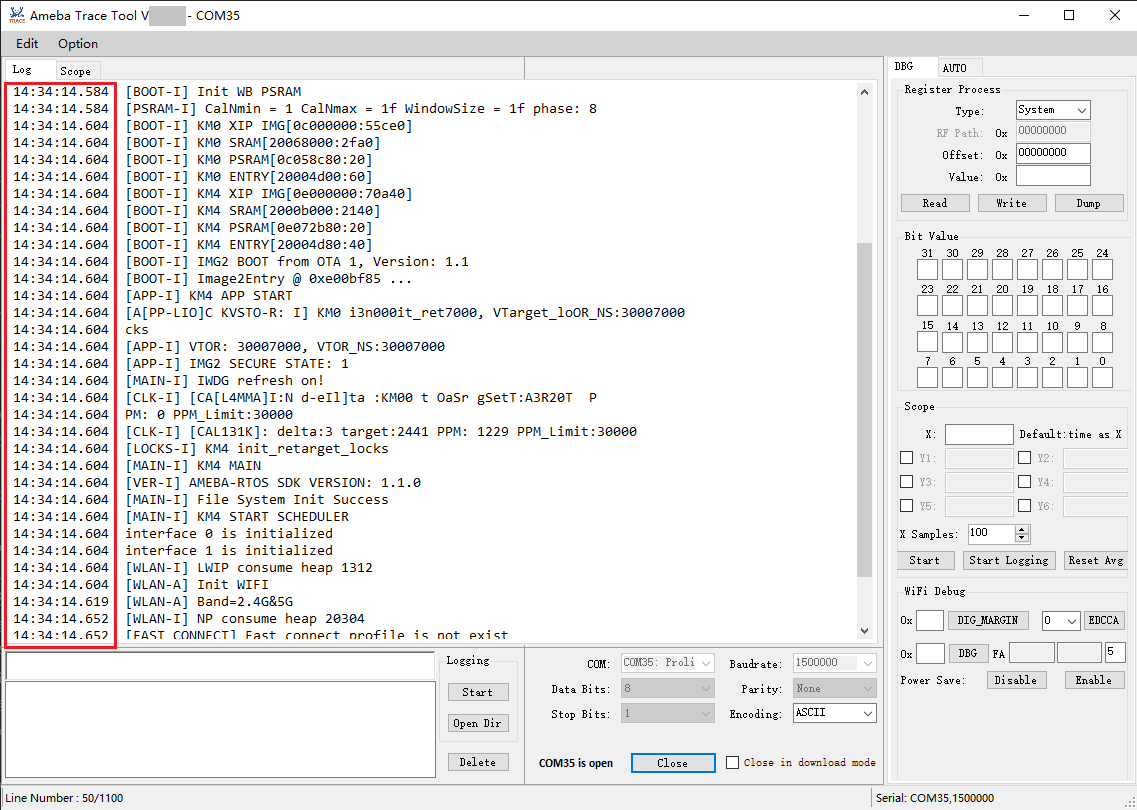
Timestamp
To add timestamps to log entries:
Click the Option menu
Select the Global Settings menu item
Check the Timestamp checkbox
Note
Displayed timestamps may lag behind actual log generation times due to processing delays in Trace Tool.
Send Commands
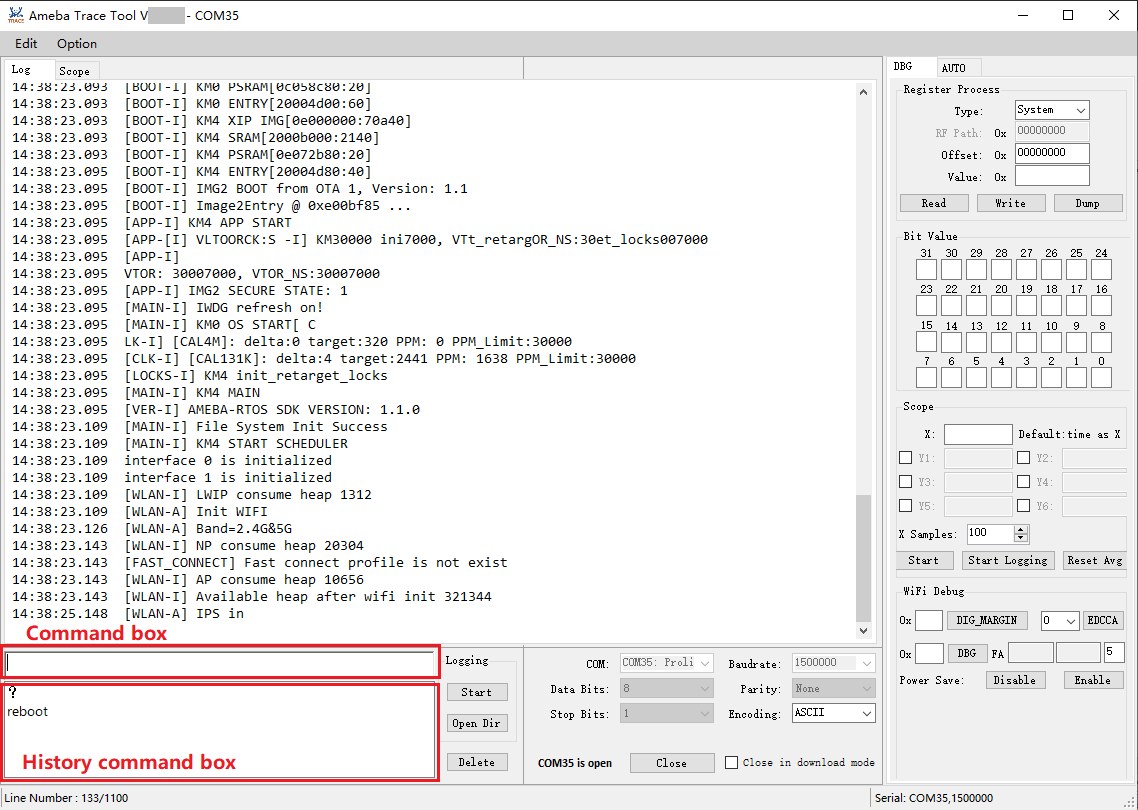
To send commands to the attached device:
Input a command in the command box.
Note
Refer to Command Prefix to determine whether a command prefix needs to be added before the command.
Press the Enter key.
The history command box records previously sent commands.
Click a command to display it in the command input box.
Double-click a command to send it to the chip.
The history command list can be cleared, saved, or loaded from the
Edit>History Commandsmenu.
Command Prefix
When multiple cores in different SoC models perform distinct roles, specific command prefixes shall be used to identify core-specific operations.
Core |
Role |
Command Prefix |
|---|---|---|
KM4 |
AP |
None |
KM0 |
NP |
@ |
Core |
Role |
Command Prefix |
|---|---|---|
KM4 |
NP |
@ |
KR4 |
AP |
None |
Core |
Role |
Command Prefix |
|---|---|---|
KM4 |
AP |
None |
KR4 |
NP |
@ |
Core |
Role |
Command Prefix |
|---|---|---|
KM4 |
NP |
@ |
KR4 |
AP |
None |
Core |
Role |
Command Prefix |
|---|---|---|
KM4 |
AP |
None |
KR4 |
NP |
@ |
Core |
Role |
Command Prefix |
|---|---|---|
DSP |
Algorithm |
~ |
KM4 |
NP |
@ |
KR4 |
AP |
None |
Core |
Role |
Command Prefix |
|---|---|---|
DSP |
Algorithm |
~ |
KM4 |
AP |
None |
KR4 |
NP |
@ |
Core |
Role |
Command Prefix |
|---|---|---|
DSP |
Algorithm |
~ |
KM4 |
NP |
@ |
KR4 |
AP |
None |
Core |
Role |
Command Prefix |
|---|---|---|
DSP |
Algorithm |
~ |
KM4 |
AP |
None |
KR4 |
NP |
@ |
Core |
Role |
Command Prefix |
|---|---|---|
CA32 |
AP |
None |
KM4 |
NP |
~ |
KM0 |
Firmware |
@ |
Core |
Role |
Command Prefix |
|---|---|---|
KM4TZ |
AP |
None |
KM4NS |
NP |
@ |
Register Access
The Register Access function is used to read from and write to register values via their addresses.
Type: Selects the register type.Systemaccesses system registers, whileWifi MAC/Wifi BB/Wifi RFare for Wi-Fi functionalities, each having a different base address. Select the appropriate option based on your requirements.Offset: The register address to access.RF Path: The RF path to access, only applicable whenTypeisWifi RF.Read/Write: Reads or writes the register value at the specified address. The value to write is entered in the value box.Dump: Bulk-prints a range of registers. Supported only forWifi MAC/Wifi BB/Wifi RF.Bit Value: Displays the 32 bits of the addressed register and allows bit-wise access.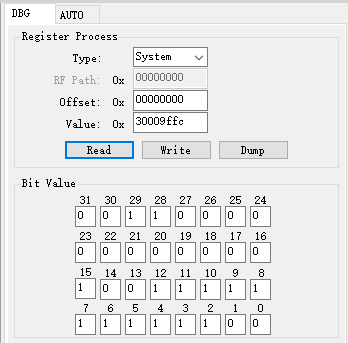
Scope Function
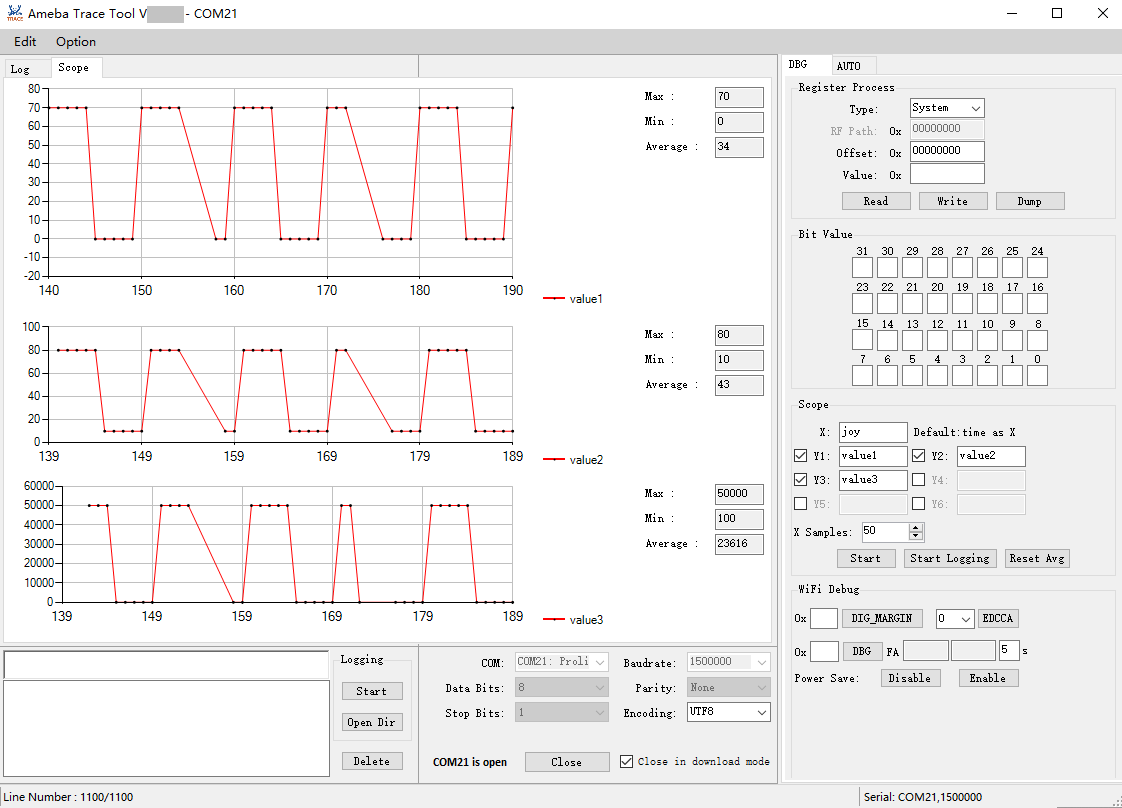
The scope function is used to capture specific data from logs and dynamically display waveform patterns. This feature has been supported since version v2.1.28.
Enter the X pattern and one or more Y patterns (
Y1toY6); the default value of X is time. Enable each Y channel with its checkbox.Set the number of samples to capture.
Click the Start button.
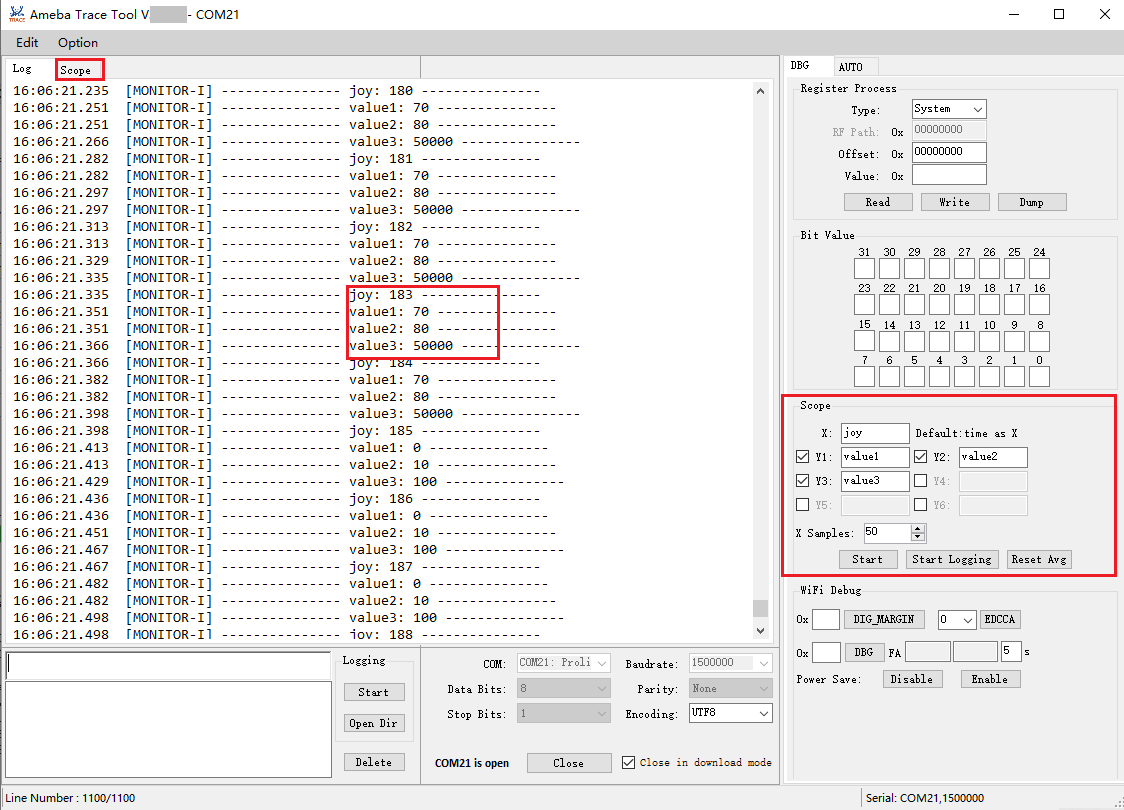
In the Scope tab, the waveform will be displayed synchronously.
Note
Click Start Logging to save the captured scope data to a file.
Wi-Fi Debug
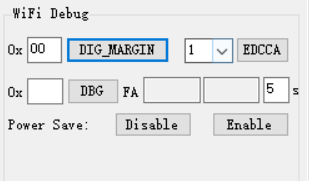
DIG_MARGIN: Set the Wi-Fi DIG margin, available address: [0x00, 0x3c].EDCCA: Set the MAC EDCCA mode, available value: 0/1/9.DBG: Set Wi-Fi RA debug, available address: [0, 0xff], and display the average values of CCK_FA and OFDM_FA.Power Save: Enable or disable Wi-Fi power saving mode.
Diagnose
The Diagnose function reads the diagnostic events recorded by the device firmware, displays them in a table, and supports deleting or exporting them. It is available on devices whose firmware supports the diagnose feature.
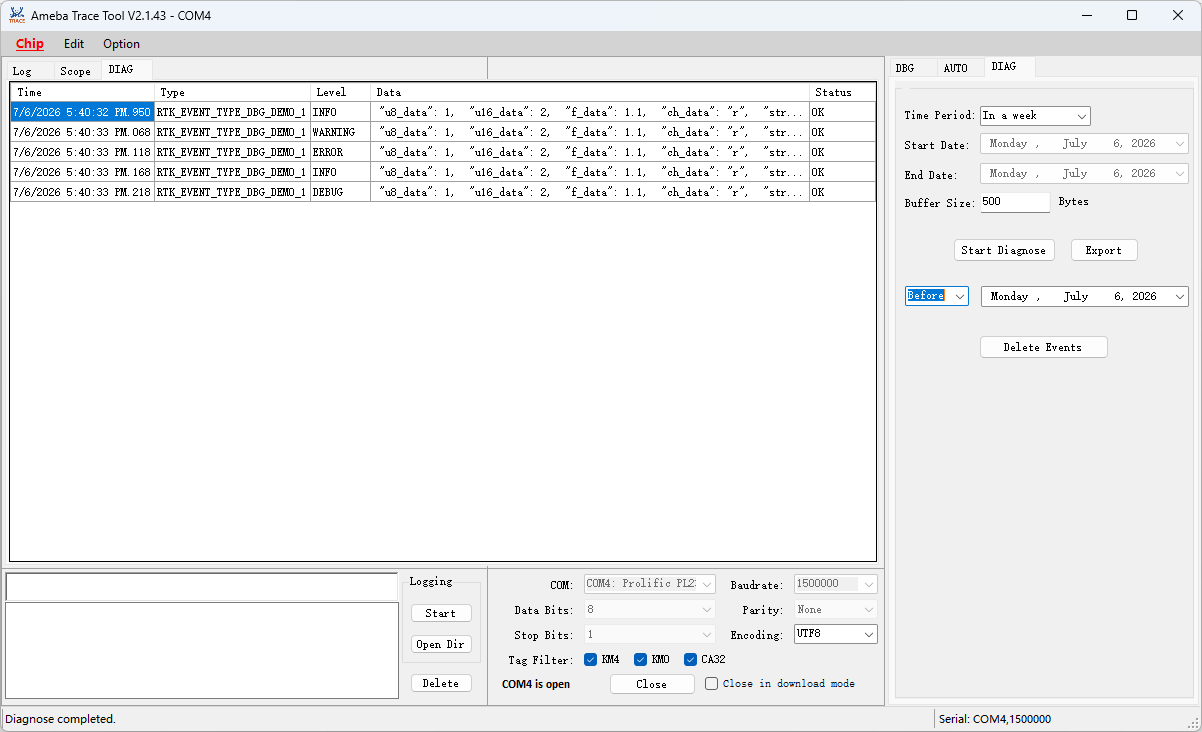
The controls are located in the DIAG tab:
Time Period: Selects the time range of events to read —In a day,In a week,In a month,Custom options, orAll; the default isIn a week. WhenCustom optionsis selected, theStart DateandEnd Datefields become editable to specify a custom range.Buffer Size: The transfer buffer size in bytes, ranging from 200 to 4000 (default 500).Start Diagnose: Reads the diagnostic events within the selected time period from the device and displays them in the DIAG results table.Delete Events: Removes the events recorded before (Before) or after (After) the selected date. A confirmation dialog is shown before the events are removed.Export: Exports the diagnostic results table to an Excel file.
Note
The serial port must be opened before starting a diagnose or delete operation.
During a diagnose operation, Trace Tool temporarily switches the LOGUART to diagnose mode, so log reception is paused until the operation completes.
Automation Script
The AUTO tab provides support for automatic script execution.
Click the Browse button to choose the script you want to execute.
Click the Execute button to execute the script.
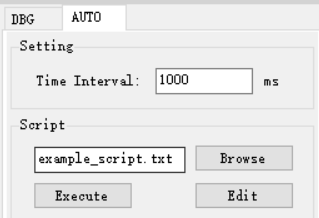
The AUTO tab also provides the following helpers:
Template: Loads a script template into the editor.
Edit: Opens the selected script in an external editor.
Time interval: Sets the delay (in milliseconds) inserted between consecutive commands.
Note
The script syntax reference can also be opened from the Help > Get Script Format menu.
The general format of the automatic script:
CMD1
CMD2
CMD3
…
Keyword loop can be used to execute commands repeatedly:
loop=10
loop_start
CMD1
CMD2
sleep 1000
…
loop_end
The keywords and specific rules within the loop are as follows:
Loop: The number afterloop=means loop times.loop_start: Used to mark the beginning of the loop.loop_end: Used to mark the end of the loop.loop_startandloop_endmust appear in pairs.sleep: Used to delay some time between commands, and unit is millisecond.sleep 1000means to delay 1000ms. There should be a blank space between sleep and sleep time.
Nested loops are supported, and they can be structured as follows:
loop=2
loop_start
CMD1
sleep 1000
loop=3
loop_start
CMD2
sleep 2000
loop_end
loop_end
Catching certain patterns, like pass_pattern or fail_pattern , to indicate that the result of specific CMD execution is supported, the format is as below:
loop=10
loop_start
timeout=1000
pass_pattern=xxx
fail_patern=xxx
CMD1
if fail/pass/timeout
break
fi
CMD2
…
loop_end
The key word
pass_pattern,fail_patternandtimeoutare only valid for the next command CMD1, used to catch patterns in CMD1 execution.When a pattern is detected, the keyword
if...fican be used for subsequent operations. Currently, only thebreakoperation is supported, which is used to exit a loop.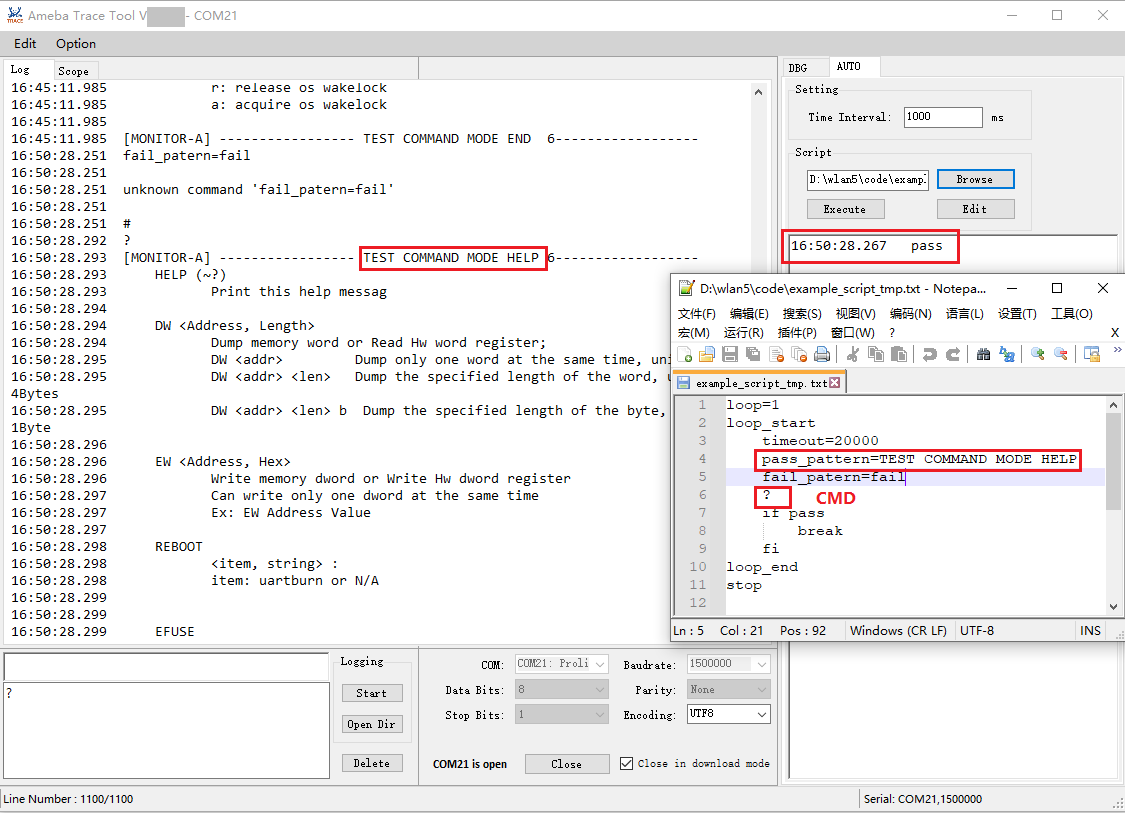
The number following
timeout=represents the waiting time for capturing matching characters. If this time is exceeded, capturing will stop. It can be set to different values as needed (unit: milliseconds), with a default value of 5000.The string following
pass_pattern=indicates the pass pattern, whilefail_pattern=indicates the fail pattern, used to denote the result of the CMD execution.
When executing a CMD, there are three possible outcomes:
Pass: pass_pattern is matched in the CMD execution result within the timeout period.Fail: fail_pattern is matched in the CMD execution result within the timeout period.Timeout: Neither pass_pattern nor fail_pattern is matched in the CMD execution result within the timeout period.
Note
For FreeRTOS SDK related applications, please refer to AT CMD documentation to customize automation script.
Caution
Only one command is allowed per line.
Indent a line using a TAB. Only TABs are permitted; spaces are not allowed.
No spaces are allowed before or after the “=”.
Troubleshooting
When encountering issues while using Trace Tool, refer to the following common cases:
Port Cannot Be Opened
Issue: Opening the serial port fails with an error message.
Solution: The port is likely already in use by another process. Close any other terminal application (for example, PuTTY, Tera Term, another Trace Tool instance, Web Flash Tool, or a VS Code serial monitor) that may be holding the port, and then try opening it again.
Garbled Logs
Issue: Logs are unreadable or contain stray characters.
Solution: Verify that the baud rate, encoding and other configurations match those configured in the device firmware.
BT Logs Are Not Captured
Issue: Bluetooth host or firmware logs are not written to *.bin / *.log files, or an external analyzer fails to connect to Trace Tool over TCP.
Solution:
Confirm the connected SoC is selected from the
Chipmenu. The Bluetooth AGG paths are only registered when the actual SoC is selected; theGenericfallback does not define BT paths.Trace Tool listens on TCP ports
5000(BT upper stack) and5001(BT firmware) for analyzer connections. Close any other Trace Tool instance that may already be holding these ports, and ensure the host firewall allows inbound connections on both ports.
Scope Trend Chart Not Updating or Shows Incorrect Values
Issue: In the Scope tab, a Y channel’s waveform stops updating, plots the wrong value, or never receives any data even though the matching text is visible in the log.
Solution: For each log line, Trace Tool locates the configured X/Y1-Y6 pattern text with a plain substring search, then extracts the first plain base-10 integer (optionally with a leading -) found between that text and the end of the line. The firmware log must follow this format for the value to be captured correctly:
Print the pattern text and its value on the same line, with the value immediately following the pattern text (for example,
printf("Temp: %d\n", temp);).Use a plain decimal integer. Hexadecimal (
0x1A), floating-point (3.14), or non-numeric payloads are not parsed correctly — Trace Tool extracts only the first run of digits, so0x1Ais read as1and3.14is read as3; a line with no digits after the pattern text is silently skipped and the chart is not updated.Make each pattern text an exact, distinctive substring of the log line. Because matching is substring-based, a short or overlapping pattern (for example, one pattern name that is a prefix of another) can match the wrong occurrence.
Put each
Ymetric on its own log line. Trace Tool only evaluates the first configuredYpattern found in a given line; other metrics printed on that same line are ignored for that update.
Diagnose Command Execution Failed
Issue: The DIAG tab reports Command 'AT+DIAG=...' execution failed after 5 attempts when clicking Start Diagnose.
Solution:
Open the serial port before clicking Start Diagnose. The diagnose operation owns the serial port exclusively and cannot be initiated from a closed port.
Verify that the device firmware supports the diagnose feature. If the firmware version reported by
AT+DIAG=VERdoes not match any profile shipped with Trace Tool, event decoding will not be available.
Settings Reset on Launch
Issue: Trace Tool starts with default settings (COM port, baud rate, selected SoC, etc.) even though the previous session was saved correctly.
Solution: If Setting.json was written by an older build of Trace Tool, the file may contain values that the current build no longer recognizes. Trace Tool silently falls back to defaults in this case rather than crashing. Delete the Setting.json file located next to AmebaTraceTool.exe and relaunch; the file will be regenerated with the current schema.