The Ameba extension is a VS Code extension developed based on Cline. It retains all the native features of Cline while adding specialized functions for the Realtek Ameba series of chips, including development environment checks and automatic installation, SDK configuration, code compilation, firmware flashing, and serial monitoring. These features simplify the development process of the Ameba series chips through intuitive buttons and interfaces.
This plugin supports SDK v1.1 and higher only. The v1.0 branch is not supported.
Installing the Extension
Method 1: In the VS Code Marketplace, search for Ameba and click install.
Method 2: Download the Ameba extension’s VSIX file , and in VS Code, click Extensions > Install from VSIX…, then select the downloaded VSIX file to install.
Note
Steps for manually updating the plugin:
Uninstall the current old version of the plugin
Reload the window Ctrl+Shift+P > Developer: Reload Window
Install the new version of the plugin, then reload the window again to avoid plugin conflict issues
Using Ameba-only Features
On the welcome page shown on first use, you can log in with a Cline account or use a custom API Key.
If you do not have a Cline account or API key, you can click the USE Ameba Only button to use only the Ameba-related features.
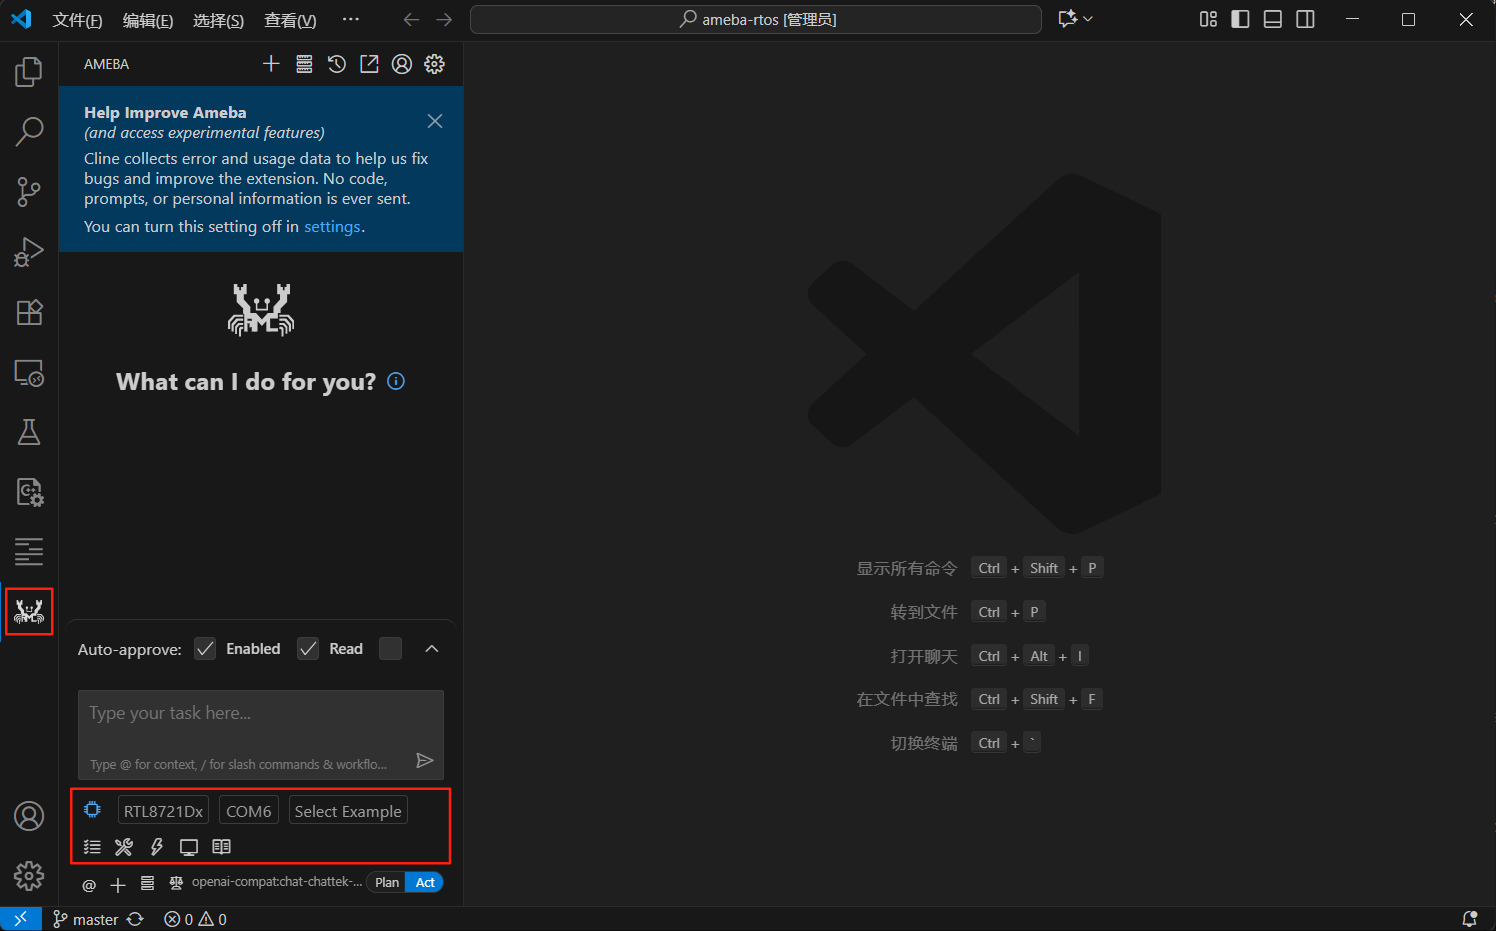
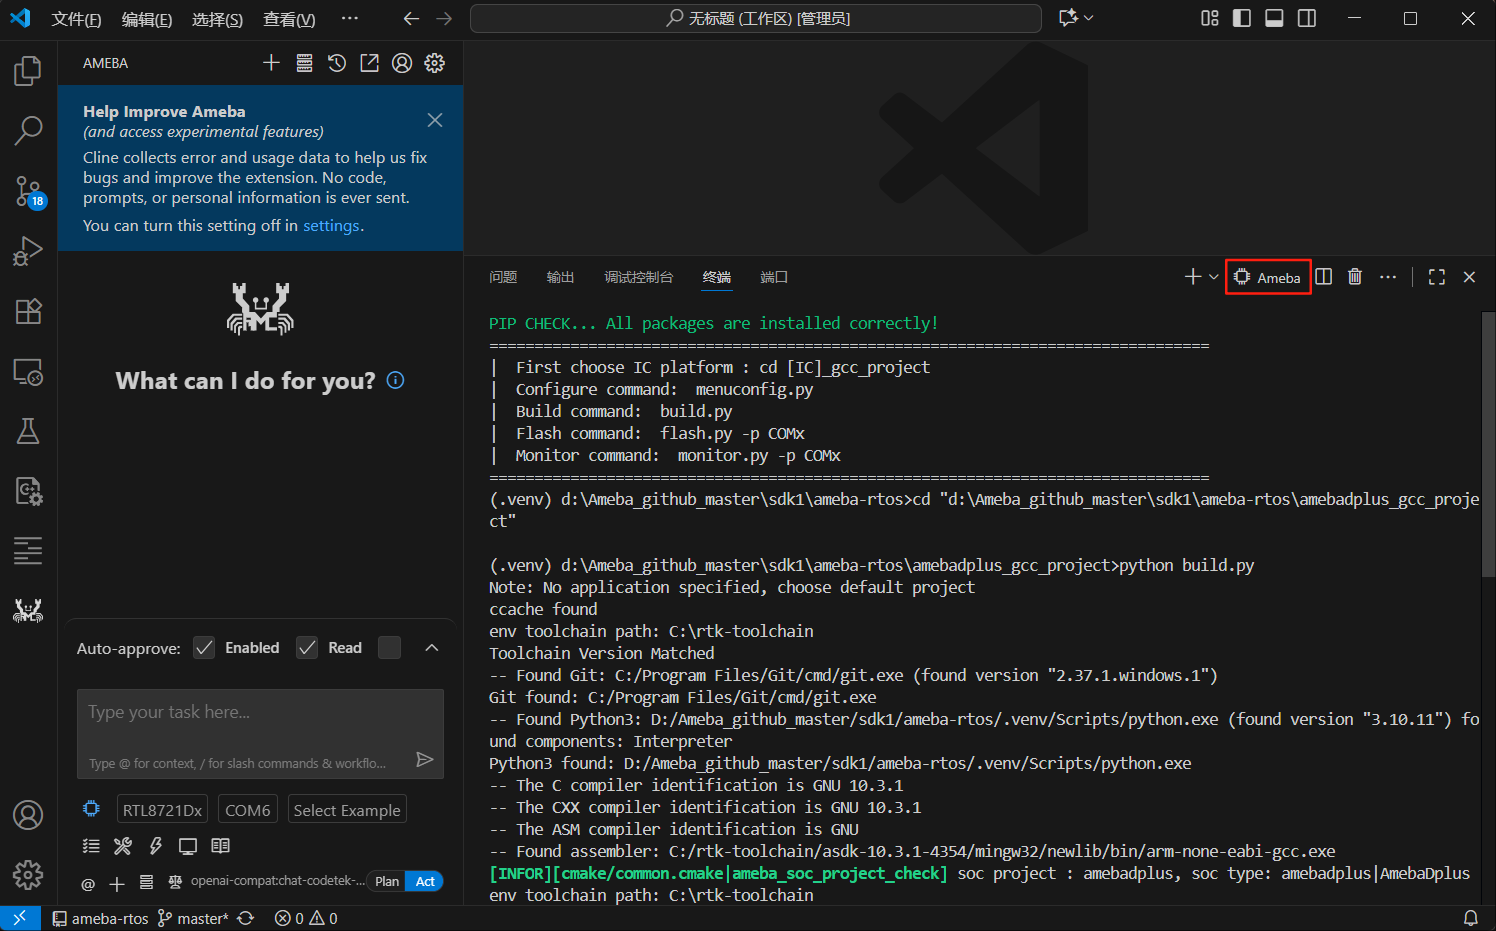
Ameba Feature Area
The red box in the figure below highlights the Ameba-related feature area.
Environment Check and Auto-Installation
The extension automatically checks the following configurations:
Whether the opened folder or its subfolders contain the Ameba SDK.
Whether the prebuilts for the development environment are installed correctly. If not, two installation options will be provided in the bottom-right corner: Install from GitHub and Install from Aliyun (users in mainland China are recommended to use Aliyun). Click to automatically download and install the prebuilts, and the Python virtual environment will also be automatically created.
If the prebuilts for the development environment are installed correctly, but the Python virtual environment for the SDK has not been created correctly, a notification will appear in the bottom-right corner. Click the Setup Now button to automatically create it.
The Ameba-related feature buttons will only be activated after all the above checks have passed.
Debug Dependency Plugin Installation
The plugin will automatically check if the development environment has installed the plugin Realtek.ride-debug which is required for debug functionality.
If Realtek.ride-debug is not installed in the development environment, a prompt will appear in the lower right corner asking if you want to install it. Click the Install Ride Debugger button to automatically install it.
If Realtek.ride-debug is installed but the version is lower than 1.4.5, a prompt will appear in the lower right corner asking if you want to uninstall and reinstall it. Click the Uninstall and reinstall button to automatically uninstall and reinstall it.
Chip Selection
Select the Ameba series chip you want to develop for from the dropdown menu.
Serial Port Selection
The extension automatically scans and updates all available serial ports in the system. Select the corresponding serial port for your development board from the dropdown menu.
Example Selection
Select the corresponding application example from the dropdown menu.
After selecting an example, a preview of its corresponding README.md file will be opened.
By default, or by selecting None in the examples, the base project configuration will be compiled.
Go to Settings > Extensions > Ameba to configure parameters. The plugin supports the following optional configurations:
Category
Parameter
Description
Debug
Adapter Speed
Sets the clock frequency of the debugging adapter (kHz), default value is 4000
Debug
Adapter Type
Specifies the type of debugging adapter:
Daplink (default)
Jlink
Debug
Request Type
Specifies the type of debug request:
Attach (default): Attach mode. Suitable for connecting to a running target chip. The chip will not be reset at the start of debugging; execution continues from the current location without disturbing the live system.
Launch: Launch mode. Suitable for regular development. The chip will be reset at the start of debugging; the program restarts from the specified entry function.
Debug
Run To Entry Point
Only effective in Launch mode. Specifies the function entry point where the program will automatically pause after start (e.g., main).
Debug
All Stop
All stop mode, specialized for multi-core debugging, enabled by default.
When any core is suspended due to hitting a breakpoint or pressing the pause button, all cores will automatically suspend.
Debug
Run Sync
Synchronous run, specialized for multi-core debugging, disabled by default.
When stepping over, stepping into, or pressing “continue,” all cores perform the respective actions synchronously. Must be used with All Stop.
Debug
Live Watch
Live monitoring. Configures whether to enable real-time variable refresh (without pausing the CPU).
Debug
Live Watch Core
Set when Live Watch is enabled. Specifies the target core for real-time monitoring.
Debug
Live Watch Samples Per Second
Set when Live Watch is enabled. Sets the refresh rate of live monitoring data, measured in samples per second.
Flash
Baud Rate
Sets the flashing baud rate, default value is 2000000 bps.
Flash
Include Vfs
Whether to include vfs.bin when flashing, not included by default.
Flash
Memory Type
Specifies the type of Flash as Nor or Nand, default is Nor Flash.
Flash
Reset Board
Attempts to reboot the device after flashing, enabled by default.
Monitor
Enable Log
Whether to enable saving of monitoring logs, disabled by default.
Monitor
Log Directory
Specifies the folder path for saving logs, only effective when Enable Log is enabled.
Monitor
Reset Board
Attempts to reboot the device when monitoring is enabled, enabled by default.
Note
Settings Priority (from highest to lowest):
Workspace Settings: Apply only to the currently opened workspace.
Remote Settings: Apply to remote development environments connected via Remote-SSH, etc.
User Settings: Apply globally to all VS Code instances for the current user
Default Settings: Built-in default configuration values from extensions
Override Rule: When the same setting is defined at multiple levels, higher-priority configurations override lower-priority ones.
After finishing the SDK menuconfig, you must save and exit menuconfig interface correctly. If you do not save and exit correctly, it will affect the normal use of other functions. A notification will appear in the bottom-right corner to remind users.
Continue: Resume program execution (default shortcut F5).
Pause: Pause the running program (default shortcut F6).
Step Over: Execute the current line without entering the function (default shortcut F10).
Step Into: Execute step by step and enter the function (default shortcut F11).
Step Out: Return from the current function to its caller (default shortcut Shift+F11).
Variables
This is the most frequently used view during debugging; it displays all data visible at the current stop location. The system automatically categorizes:
Local: Local variables within the current function’s scope.
Global: Global variables.
Static: Static variables within the current file.
Registers: Register values of the current CPU core.
Breakpoint
Breakpoint are the most commonly used tool during debugging. When execution reaches a breakpoint, it pauses automatically, allowing you to inspect current variables or register information.
Method
Breakpoint Management
Line Number Click
Add: Click the blank area to the left of the line number in the editor (a red dot will appear).
View: Use the Breakpoints panel on the left to list all breakpoints.
Delete: Click the red dot again to remove the breakpoint.
Right-Click Menu
Add: Right-click in the code area and select Add Hardware Breakpoint.
View: Use the Breakpoints panel on the left to list all breakpoints.
Delete: Use the Breakpoints panel to delete selected breakpoints.
Debug Console
Add: When the program is paused, enter GDB commands in the debug console
Function breakpoint: b function_name
(Example: b main, pauses at the entry of the main function)
Conditional breakpoint: b location if condition
(Example: b main if count > 10, triggers when the condition is met)
Thread breakpoint: b function_name thread thread_ID
(Example: b shared_func thread 8, triggers when the specified thread reaches this function)
Line breakpoint: b line_number
(Example: b 100, pauses at line 100 of the current file)
File line breakpoint: b filename:line_number
(Example: b main.c:50, pauses at line 50 of the specified file)
Address breakpoint: b *address
(Example: b *0x08001234, pauses at the specified memory address)
View: info breakpoints or info b
Delete: delete breakpoint_number or d breakpoint_number
(Example: delete 2, deletes breakpoint number 2)
Note
Different chip architectures have a limited number of hardware breakpoints. Exceeding this limit will cause breakpoints to become invalid.
Watchpoint
Watchpoint monitor changes to memory addresses or variables, interrupting the program when a value is read, written, or modified.
Method
Watchpoint Management
Right-Click Menu
Add: When the program is paused,
Monitor global variables: In the Variables panel, select a global variable, right-click and
choose Break on Value Read/Change/Access
Monitor registers: In the Variables panel, select a register, right-click and choose
Break on Value Read/Change/Access
Monitor memory addresses: In the Watch panel, add a memory watch expression, right-click and
choose :guilabel:Break on Value Read/Change/Access
View: The Breakpoints panel on the left side lists all watchpoints
Delete: In the Breakpoints panel on the left side, select and delete the selected watchpoint
Debug Console
Add: When the program is paused, enter GDB commands in the debug console
(Example: watch -l *0x2000b4f8, triggers an interrupt when the content at address 0x2000b4f8 changes)
View: info watchpoints or info watch
Delete: delete watchpoint_number or d watchpoint_number
(Example: delete 2, deletes watchpoint number 2)
Note
Different chip architectures have limitations on the number of watchpoints. Exceeding the limit will cause watchpoints to become invalid.
Watch
The Watch panel allows you to monitor variables of interest. You can monitor in the following ways:
View variables:
Right-click on a variable in the code and select Add to Watch.
When the program is paused, right-click on the target variable in the Variables panel and select Add to Watch.
Click the + button in the Watch panel and enter the variable name.
View any memory address:
Enter an address cast expression directly, such as (int)0x20000004, to view the value at that address.
Memory view: Press F1 and enter MemoryView to open a dedicated panel to inspect large memory regions in Hex.
Type casting:
Supports C-style casting; for example, (char*)my_var to view a string value.
Call Stack
When code logic is complex, the call stack clearly shows the program execution path.
Hierarchical navigation: The top frame is the current paused line, the next frame is the caller (parent function), and so on. Click different frames to jump and view the contextual variables at that time.
Multi-core Debug Control
After enabling multi-core debugging, the Call Stack view lists debug sessions for all cores. You can switch between the following collaboration modes via the buttons on the view’s title bar.
Mode
Description
Run Sync
Meaning: Synchronous run mode. While paused, issuing a debug command (e.g., Continue, Step Into) on any core will apply the same operation
to all other associated cores.
Purpose: Keep multi-core execution synchronized on the timeline to avoid inconsistencies that could cause shared-memory communication issues
or logic errors.
Action: Click the RS button to toggle.
All Stop
Meaning: Global stop mode. When any core hits a halt condition (e.g., breakpoint), all cores are forced to halt.
Purpose: Ensure global consistency of the debugging context; disabling this allows independent debugging per core.
Action: Click the AS button to toggle.
Note
The full implementation of Run Sync typically relies on the All Stop mechanism. Their relationship is as follows:
With All Stop enabled, Pause/Continue and stepping actions are synchronized across all cores.
With All Stop disabled, each core behaves independently, suitable for single-core troubleshooting.
RTOS-Aware
When RTOS-Aware is enabled, the debugger recognizes the operating system’s internal structures. When halted, the debugger displays all existing threads in the RTOS. It also allows you to inspect stacks, registers, and variables of other inactive threads.
In multi-core debugging, this needs to be controlled per core. Toggle it by clicking the RA button in the Call Stack view.
The Variables and Watch views require the program to be paused to refresh, whereas Live Watch allows observing variable changes in real-time while the program runs at full speed.
Watch types: Global variables or static variables.
How to add:
Monitor variable values in the LIVE WATCH view. Click + and enter the variable name.
While paused, any variable in the Variables view can be added to Live Watch via right-click and selecting Add to live watch.
Any register in the XPERIPHERALS view can be added to Live Watch via right-click and selecting Add to live watch.
Note
You need to configure Live Watch parameters before starting a debugging session.
Peripheral Registers
The XPERIPHERALS view allows you to view the values of on-chip peripheral registers.
Principle: Based on the chip’s SVD (System View Description) file to parse register addresses and bitfields.
Note
This view will be empty if the SVD file path is not configured correctly.
RTOS Views
The RTOS kernel views comprehensively display various kernel objects managed by the RTOS. These objects are fundamental components for task management, synchronization, and communication in embedded systems. Note that these views are only available during a debugging session.
In order to open RTOS views, press F1 and invoke command: Open RTOS View and select the view you are interested.
RTOS-TASK:
Displays the state of all tasks (Running, Ready, Blocked, Suspended).
Shows task name, address, stack usage/remaining stack space (useful for stack overflow diagnosis), runtime, and priority.
RTOS-QUEUE:
Displays queue name, capacity, current message count, and the list of tasks waiting on the queue.
RTOS-SOFTWARE TIMER:
Displays timer name, address, status (Active/Inactive, One-shot/Autoreload, Static/Dynamic), period, and callback function name and address.
RTOS-HEAP:
Displays the dynamic memory address range, allocation details, remaining heap size, and utilization.
RTOS-TASK NOTIFICATION:
Displays task name, address, the number of received and pending notifications.
If your local machine is a Windows system, the development board is connected to it, but you choose to have the SDK on a Linux server and develop using the VS Code Remote-SSH extension, you can follow these steps:
Download AmebaRemoteService and run it on your local Windows machine. By default, it starts without a password. If security is a concern, you can set a password.
In VS Code, press F1, type ameba:RemoteServers, and click the corresponding option.
Click the AddNewRemoteServer option.
Server Name:
Enter a custom name for the server.
Server Address:
Enter the IP address of your local Windows machine.
Server Password:
If you have configured a password for the AmebaRemoteService software, enter it here. Otherwise, press Enter to skip.
After successful configuration, the serial port list will update to display remote serial port information, with remote ports prefixed by R:/ .
Pressing F1 again in VS Code and entering ameba:RemoteServers allows you to view existing server information. You can click on an existing server to delete it.
Remote debugging framework is illustrated as follows:
The target chip is connected to the local Windows PC via a debug adapter.
VS Code installed on the Windows PC connects to the remote server via SSH.
When debugging starts, OpenOCD (GDB server) is launched on the local Windows PC by AmebaRemoteService. You can view OpenOCD output logs and status in the AmebaRemoteService window.
The toolchain’s built-in GDB running on the remote server connects to the locally launched OpenOCD, after which debugging operations can proceed.
Startup steps for debugging:
Complete hardware connections and basic configuration as required in Code Debugging.
In the extension, select the target chip for debugging and the remote serial port.
Click the Ameba Debug button to launch the integrated debugger.
Start code debugging; tips and techniques are the same as described in Code Debugging.