DSP Important Notes
Printf
The standard printf output function enables interrupts upon exit, so it cannot be used in interrupt handlers and critical sections. DiagPrintf can be used as an alternative. DiagPrintf does not enable interrupts but does not support floating-point printing.
DTCM Address Limitations
DTCM is a local memory with extremely low latency that enables single-cycle data access (code cannot be placed in DTCM).
Although the DTCM (DRAM) space is a continuous 256KB, it is physically composed of two independent DRAM regions (128KB each). Therefore, neither single iDMA transfers nor individual CPU vector instructions can cross the DRAM boundary (0x1FFE0000), otherwise an error will occur.
iDMA
iDMA can transfer data from PSRAM or SRAM to DTCM. When PSRAM memory bandwidth is limited, iDMA can be used to transfer large blocks of data to DTCM for ping-pong operations to improve data processing speed. However, there are the following precautions when using iDMA:
DTCM Address Limitations
iDMA only supports data transfers between system memory (SRAM/PSRAM) and local memory (DRAM 0/1) or between local memory regions. Transfers only between system memory (i.e., between SRAM and PSRAM) are not allowed.
iDMA cannot transfer across the DRAM boundary (0x1FFE0000) in a single transfer.
Interrupt Registration and Enabling
If iDMA interrupts are needed, you must not only register and enable the interrupt, but also add the control descriptor DESC_NOTIFY_W_INT when initiating the transfer task, otherwise the ISR handler will not be entered.
idma_register_interrupts(0, (os_handler)done_handler,  (os_handler)error_handler);
idma_copy_desc(dst_data, src_data, DATA_SIZE, DESC_NOTIFY_W_INT);
For practical usage of iDMA, refer to the SDK examples and Xtensa documentation.
FreeRTOS SyStick
SyStick
The SyStick Tick value obtained with xTaskGetTickCountFromISR in an interrupt handler may be inaccurate.
This API can only read the SyStick before the system enters WAIT. The true SyTick is updated only after the interrupt exits. Therefore, it is not recommended to rely directly on the Tick value for precise timing.
In scenarios requiring accurate timing, hardware timers should be used. For example, the DBG Timer which runs by default after power-on.
Stack Overflow Detection
The DSP does not have hardware stack overflow detection registers. When a stack overflow occurs, the software may not detect it immediately, causing the system to hang directly without a crash log.
Consider creating tasks statically and placing task stacks at the edge of memory blocks, then using the MPU below to detect stack overflow.
Heap Management
The DSP uses FreeRTOS’s built-in Heap_4.c heap management. Heap4’s heap space addresses are contiguous and can only be allocated from PSRAM.
The SDK automatically partitions the remaining PSRAM memory space unused by the compiler into the Heap. SRAM space must be managed manually by the user.
To avoid heap memory address or length cacheline misalignment, portBYTE_ALIGNMENT has been set to 128 bytes, consistent with the cacheline size.
Cache
dsp_wrapper.h encapsulates common D-Cache operation interfaces:
DCache_Clean
DCache_Invalidate
DCache_CleanInvalidate
When using DMA, pay special attention to the impact of cache:
During DCache_Invalidate operation, if the length is not an integer multiple of the cacheline (128 bytes), the entire cacheline will be unconditionally invalidated, causing other data in the same line to be lost.
During DCache_Clean operation, if DMA has already written new data to memory and then DCache_Clean is executed, old data will be flushed from cache to memory, overwriting the DMA results and causing data corruption.
MPU Entry
If more fine-grained memory protection is needed, you can add new MPU regions on top of the default MPU table. Up to 16 entries are available, and the SDK uses 7 by default.
Note
The mpu_table.c file must be modified synchronously in both the RTK_LSP path and the project_dsp path of the project.
For example, to prohibit DSP access to a specific PSRAM range (0x60700000 - 0x60800000):
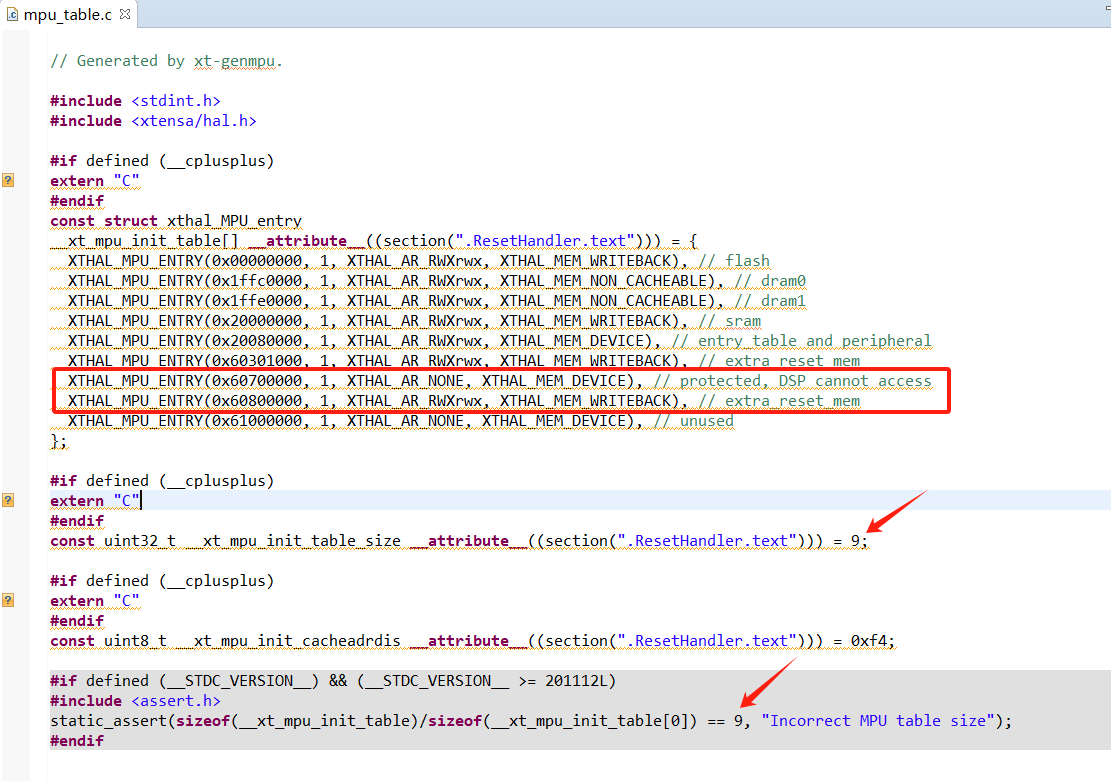
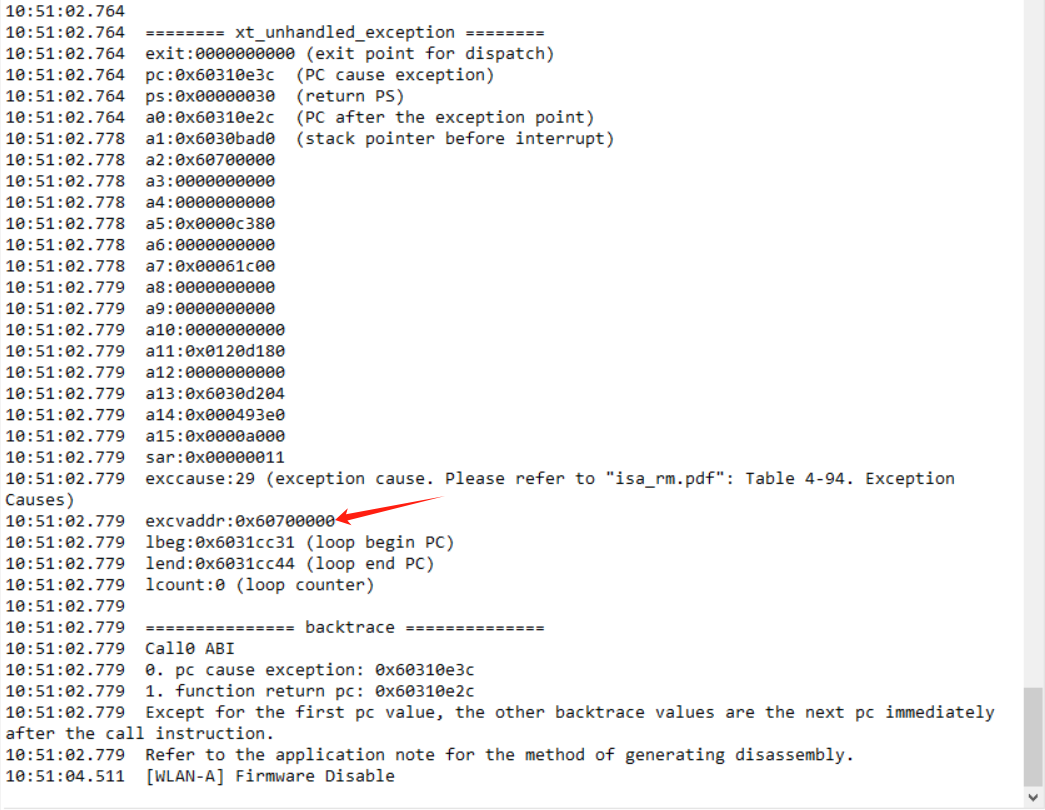
If the DSP accesses protected addresses, the following crash log will be printed:
Crash Dump Analysis
If the stack state is not completely corrupted before a crash, the DSP will print a Crash Dump log. When a crash occurs, the system is in an exceptional state. Therefore, the log information may not be completely accurate.
For example:
======== xt_unhandled_exception ========
exit:0x00000015 (exit point for dispatch)
pc:0x6034fd88  (PC cause exception)
ps:0x00000030  (return PS)
a0:0x6034fc4d  (PC after the exception point)
a1:0x1fffe540  (stack pointer before interrupt)
a2:0x606630fc
a3:0x60670a90
a4:0x60670a94
a5:0x60670a90
a6:0x60670830
a7:0x60670ad0
a8:0000000000
a9:0x00000021
a10:0x6066e4d8
a11:0x00000008
a12:0x001e9f60
a13:0x0000007c
a14:0xf2e5d8eb
a15:0xf3f8f8f8
sar:0x0000001e
exccause:13 (exception cause. Please refer to "isa_rm.pdf": Table 4-94. Exception Causes)
excvaddr:0000000000
lbeg:0x6034fd88 (loop begin PC)
lend:0x6034fd93 (loop end PC)
lcount:1614085193 (loop counter)

=============== backtrace ==============
Call0 ABI
1. pc cause exception: 0x6034fd88
2. function return pc: 0x6034fc4d
3. function return pc: 0x60335f10
4. function return pc: 0x6034b5e0
Except for the first pc value, the other backtrace values are the next pc immediately after the call instruction.
Refer to the application note for the method of generating disassembly.
The Crash Dump log consists of two parts:
1. Stack Dump
Register values: PC and other core register values. You can check the cause of the crash address based on disassembly and map files. lbeg and lend are the start and end positions of the loop code before the crash, which can also be referenced.
Exception code: The meaning of the exccause code can be found in Cadence documentation.
2. Backtrace
The backtrace result is a series of consecutively called PC values.
The function call relationship in the example log above is: 0x6034b5e0 -> 0x60335f10 -> 0x6034fc4d -> 0x6034fd88.