DSP Debugging
Preparation
Before debugging the DSP, ensure the following installations are complete:
Install the xt-ocd tool: Refer to Install Debug Plugin. xt-ocd supports DSP debugging using J-Link debugger via SWD protocol.
Install J-Link driver: The version we use is V6.44. Newer versions should also work but have not been tested.
Connect DSP to J-Link
The default installation path for Xtensa OCD Daemon is: C:\Program Files (x86)\Tensilica\Xtensa OCD Daemon 14.08.
Replace the
topology.xmlfile in the following path with the code below:Windows:
C:Program Files (x86)TensilicaXtensa OCD Daemon 14.08topology.xmlLinux:
/opt/Tensilica/xocd-14.08/topology.xml
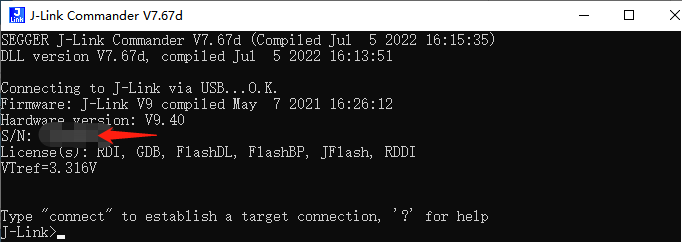
You need to modify the usbser value according to your J-Link serial number:
<configuration>
<controller id='Controller0' module='jlink' usbser='XXXXXX' type='swd' speed='4000000' locking='1'/>
<driver id='XtensaDriver0' dap='1' xdm-offset='0x80000000' module='xtensa' step-intr='mask,stepover,setps' />
<chain controller='Controller0'>
<tap id='TAP0' irwidth='5' />
</chain>
<system module='jtag'>
<component id='Component0' tap='TAP0' config='trax' />
</system>
<device id='Xtensa0' component='Component0' driver='XtensaDriver0' ap-sel='3'/>
<application id='GDBStub' module='gdbstub' port='20000'>
<target device='Xtensa0' />
</application>
</configuration>
Find the usbser value through J-Link Commander:
Debugging Methods
When using Xplorer to debug the DSP core, it is recommended to first erase the entire Flash, then download only the KM4/KR4 firmware. During debugging startup, the DSP firmware will be loaded directly into PSRAM via J-Link.
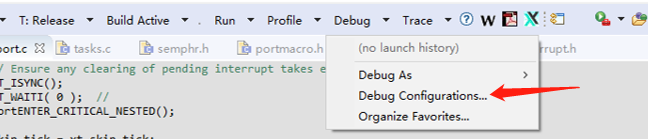
Click Debug Configurations…
Select Xtensa On Chip Debug, then create a new debug configuration. Check the Use XOCD Manager option and click the Connect button. After refreshing the OCD Version, select the 14.08 version.
Topology File should select the
C:Program Files (x86)TensilicaXtensa OCD Daemon 14.08topology.xmledited in the previous section. Connection Type should be SWD.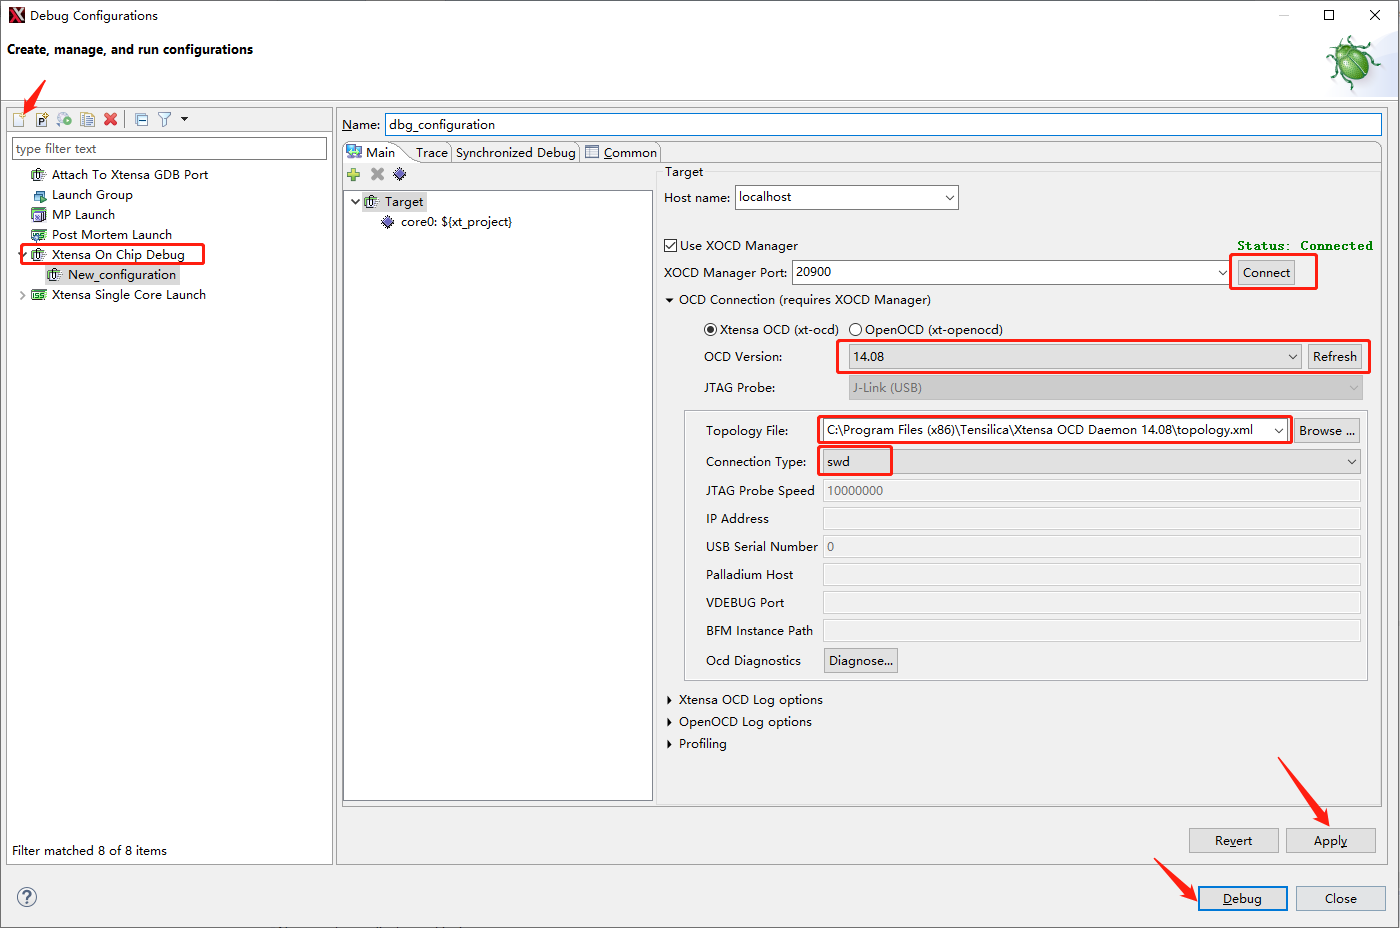
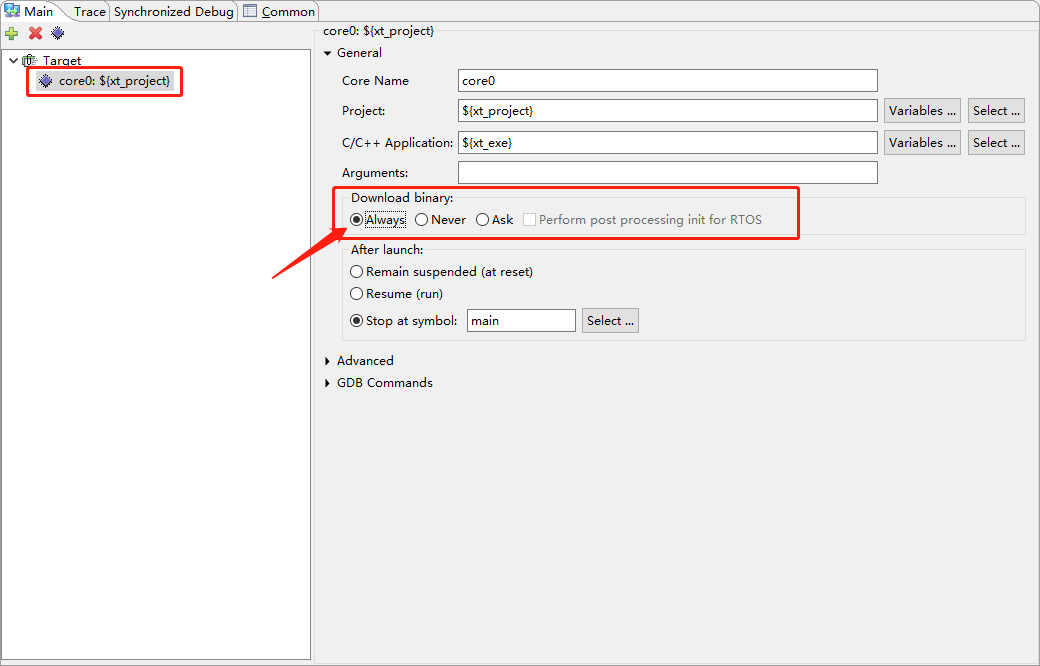
Select core0, set Download binary to Always. Then click Apply and Debug.
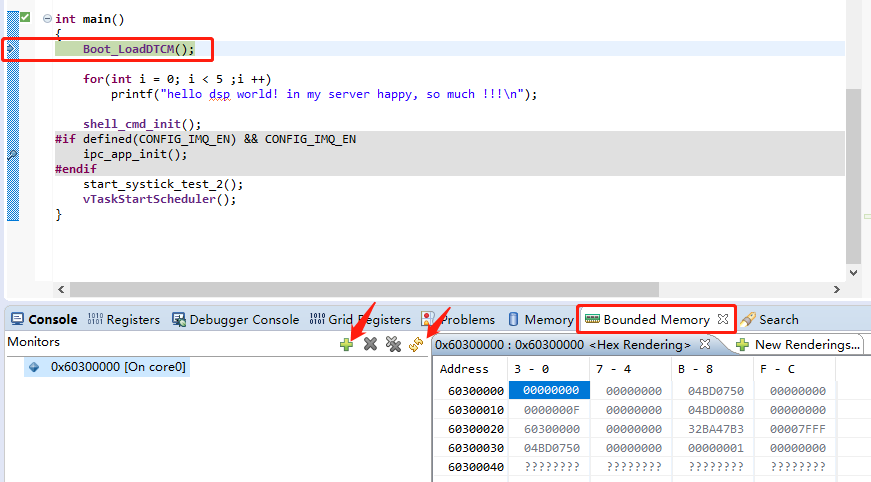
By default, the DSP core will stop at the first line of the main function. To check memory values, it is recommended to use Bounded Memory and manually refresh the memory table when memory values change.
Open a command prompt window and navigate to the directory
C:\Program Files (x86)\Tensilica\Xtensa OCD Daemon 14.08Run
xt-ocd -c topology.xml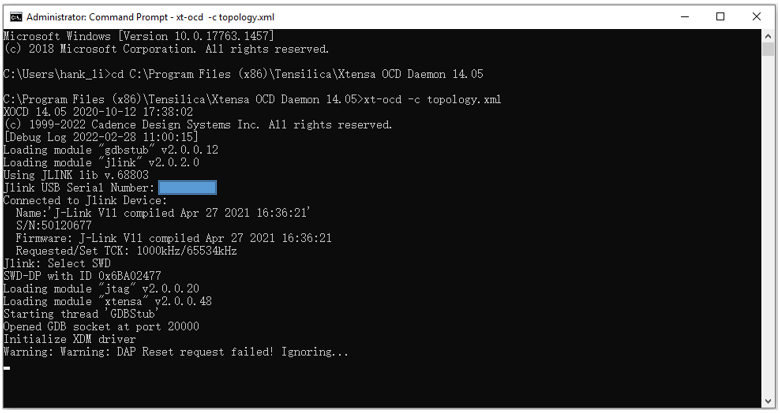
Note
Some warning messages are normal and can be ignored. If XDM driver initialization fails, you may need to initialize and start the DSP core before debugging.
In the path
<dsp_sdk>\project (or auto_ws)\project_dsp\bin\HIFI5_PROD_1123_asic_UPG\Release, there is aproject_dspfile.Copy it to the directory
C:\usr\xtensa\XtDevTools\install\tools\RI-2021.8 -win32\XtensaTools\bin.Open a command prompt window and navigate to the directory
C:\usr\xtensa\XtDevTools\install\tools\RI-2021.8-win32\XtensaTools\bin.The CMD commands for CALL0 ABI are as follows:
xt-gdb --xtensa-core=HIFI5_PROD_1123_asic_UPG project_dsp
target remote localhost:20000
reset
load
You can now proceed with normal debugging. For debugging commands, refer to: Xtensa Documentation.
Crash Dump Analysis
When the DSP triggers an unhandled exception (HardFault / illegal access / jump to a bad address, etc.), xt_unhandled_exception() prints a crash dump, then disables interrupts and spins to freeze the core at the scene for serial or JTAG analysis. The SDK provides the script <dsp_sdk>/project/img_utility/dsp_dump.py, which analyzes a dump in one step: it decodes the exception cause (exccause) and symbolizes the backtrace (recovering function names and source line numbers).
A crash dump contains:
Register block:
pc/ps/a0..a15/sar/exccause/excvaddr/lbeg/lend/lcountThe faulting task name (
task:…, valid only after the scheduler has started)A short stack hexdump
The backtrace (frame 0 is the faulting PC, the rest are the return addresses after each call)
Note
The AmebaLite multiple cores (KM4 / KR4 / DSP) share one LogUART, so their logs interleave character by character. It is strongly recommended to enable CONFIG_LOGUART_AGG_EN in the MCU SDK before analyzing a crash, otherwise the register / PC lines in the dump may be corrupted by other cores. Once enabled, each line is tagged by core (DSP = [AP], KM4 = [HP], KR4 = [LP]).
Analyzing with dsp_dump.py
The script depends only on the Python3 standard library. Add the Xtensa tools to PATH first, then feed it a log containing the dump:
export PATH=$PATH:/opt/xtensa/XtDevTools/install/tools/RI-2021.8-linux/XtensaTools/bin

python3 <dsp_sdk>/project/img_utility/dsp_dump.py serial.log     # read a serial log file
cat dump.txt | python3 <dsp_sdk>/project/img_utility/dsp_dump.py # or pipe / paste
Common options:
Option |
Description |
|---|---|
|
Parse only the DSP(AP) frames |
|
Decode exccause and list raw PCs only, without symbolization |
|
Manually specify the project_dsp ELF (the linked ELF, not the |
|
Manually specify the |
Key behaviors:
Auto-detects the ELF and xt-addr2line: the ELF is searched by default at
auto_ws/project_dsp/bin/*/Release/project_dsp, and the tool is searched in PATH /$XT_ADDR2LINE/ the Xtensa install directory. If not found, it prints a clear error listing the locations searched and how to fix it (add to PATH / pass--elf/ build first), and falls back to printing raw PCs.Compatible with multi-core aggregation prefixes: it automatically strips leading timestamps and
[AP]/[HP]/[LP]/ … tags anywhere on the line.Automatically picks the most recent dump: a single serial log often contains multiple crashes, and only the most recent one matches the addresses of the currently flashed ELF; the script parses the last dump by default and prints a hint. Be sure the ELF is from the same build as the firmware that produced the dump, otherwise all symbols will be wrong.
Example output:
task     : svc
pc       : 0xbad00000
exccause : 12  InstrPIFDataErrorCause
           PIF data error during instruction fetch
excvaddr : 0xbad00000  (faulting address)

=============== backtrace ==============
 0. 0xbad00000 [AP]  ??            (??:0)
 1. 0x60306790 [AP]  svc_parse     (main.c:138)
 2. 0x60306766 [AP]  svc_dispatch  (main.c:149)
 3. 0x60306720 [AP]  svc_handle    (main.c:154)
 4. 0x603066c2 [AP]  svc_task      (main.c:161)
How to Read the Backtrace
Frame 0 is the faulting PC; the remaining frames are the return addresses after each call (during symbolization, return-address frames are queried with
pc-1so they land on the correct call-site line number).The DSP currently uses the Call0 ABI. Call0 has no ABI-mandated frame chain, so the backtrace uses stack scanning plus call-instruction validation: it never misses a real frame, but occasionally includes a stale false positive. After symbolization, functions that do not belong to the call chain are obvious at a glance and can be ignored.
exccause Quick Reference (Common)
dsp_dump.py gives the full name directly; here are the ones most commonly encountered:
exccause |
Name |
Meaning |
|---|---|---|
2 |
InstructionFetchErrorCause |
Internal physical address / data error during instruction fetch |
3 |
LoadStoreErrorCause |
Internal physical address / data error during load/store |
9 |
LoadStoreAlignmentCause |
Unaligned load/store |
12 |
InstrPIFDataErrorCause |
PIF data error during instruction fetch (e.g. jump to a bad address) |
13 |
LoadStorePIFDataErrorCause |
PIF data error during load/store (e.g. access to an unmapped address) |
28 / 29 |
Load/StoreProhibitedCause |
Access to a page that does not allow load/store (MPU / Region) |
32..39 |
Coprocessor{n}Disabled |
Used a coprocessor instruction while cp{n} is disabled (n = code − 32) |
Manual Approach Without the Script
Run xt-addr2line -f -C -e <project_dsp ELF> <pc0> <pc1> … manually (return-address frames can use pc-1), or look up addresses directly in project_dsp.asm (see Build Debug Files).
Debugging Tips
If you cannot connect to the debug port, it may be because the SWD port is disabled (SWD port is used as a regular GPIO). You need to enable the SWD function for the GPIO.
Generate DSP disassembly and map files: Build Debug Files.
For convenience in Linux environment, you can add the following paths to PATH:
/opt/Tensilica/xocd-14.08
/opt/xtensa/XtDevTools/install/tools/RI-2021.8-linux/XtensaTools/bin
If you use
auto_build.shinstead of Xplorer to build the project, you can find the project_dsp elf file at:<dsp_sdk>/auto_ws/project_dsp/bin/<configuration_name>/ReleaseFor more debugging guides, please refer to Xtensa Documentation.
xt-ocd Debugging Issues
Problem Description: When debugging in Linux Xplorer, a Cannot Find OCD Daemons error occurs.
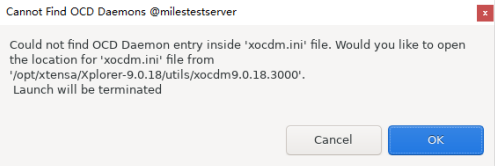
Cause Analysis: The xt-ocd version or path is not configured correctly.
Solution: Add a line after # [XOCDInstallations] in the file /opt/xtensa/Xplorer-9.0.18/utils/xocdm9.0.18.3000/xocdm.ini:
14.08=/opt/Tensilica/xocd-14.08