DSP ISS Simulation
Using the Instruction Set Simulator (ISS) for program profiling helps developers quickly identify performance bottlenecks during the performance optimization phase, thereby optimizing algorithm architecture. The computational capability of logic units in ISS simulation is basically the same as that of the actual chip (for example, when data/code are in cache, the memory characteristics of Cache and DTCM are obtained from configuration, which ensures the accuracy of this part). In the simulation environment, only one type of system memory is supported, so the ISS system memory model can only be configured as either PSRAM or SRAM. The difference in memory models will introduce performance errors. Depending on different program characteristics, the simulation error is generally within 10%, with a maximum of about 20%.
Note
Multi-core IPC communication is not supported; only DSP kernel algorithm simulation is supported.
Since it is precise instruction simulation, the simulation speed is slow, and simulating large projects takes a long time.
It is recommended to use Xplorer’s GUI interface for simulation. If Xplorer is installed on a Linux server, you can enable the server’s X11 remote GUI for use.
Build Project
Modify
<dsp sdk>\project\RTK_LSP\RI-2021.8\HIFI5_PROD_1123_asic_UPG\RTK_LSP\specsfile.*startfile: crt1-sim%O%s crti%O%s crtbegin%O%s _sharedvectors%O%s _vectors%O%s *endfile: crtend%O%s crtn%O%s *lib: -lc -lsim -lc -lhandler-reset -lhandlers-sim -lhal -lc
Edit the code and add the
exit()simulation exit function, for example:#include <xtensa/sim.h> int main() { xt_iss_client_command("isa_profile", "enable"); xt_profile_enable(); // "Start with counting off" Option app_example(); // function for profile xt_profile_disable(); exit(1); }
Rebuild the project.
Configure and Start Simulation
Click on the toolbar, rename the simulation task as needed, and check Enable ISA profiling in the Profiling Mode Options.
Modify the simulation parameters for SRAM and PSRAM in the Memory Modeling Options (by default, code and data are in PSRAM):
Item
SRAM Read
SRAM Write
PSRAM Read
PSRAM Write
Memory Waitstates (cycles)
16
2
28
28
Repeat Block Waitstates (cycles)
2
2
8
8
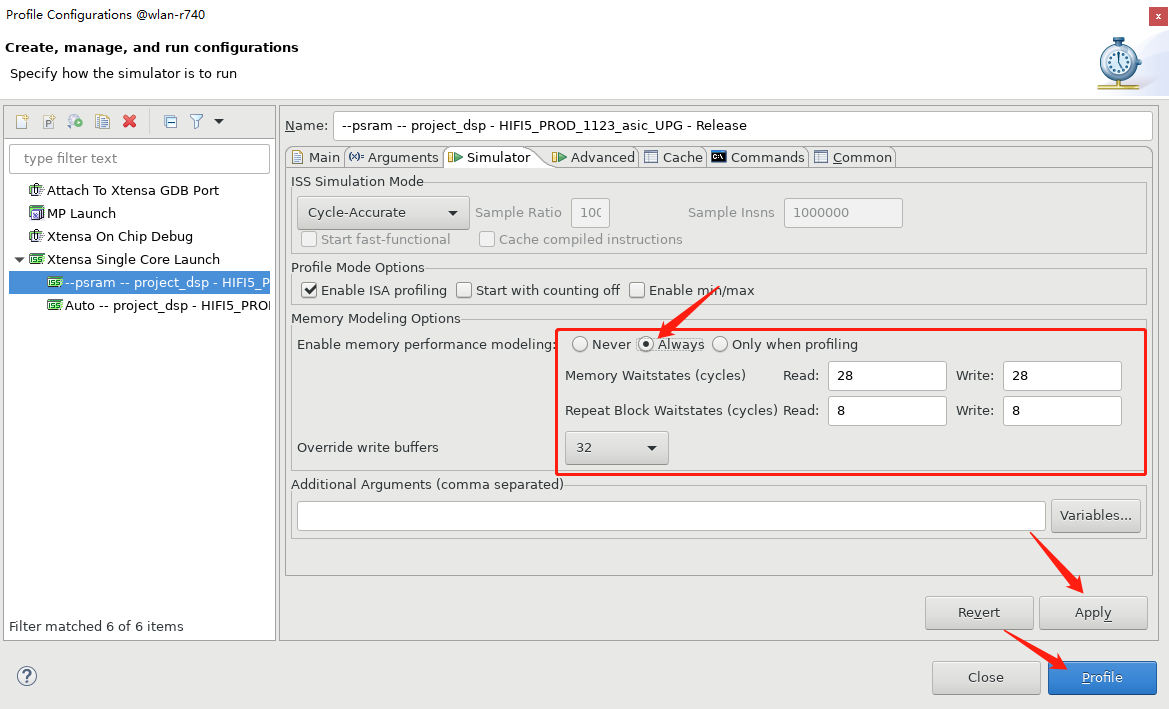
Click Apply and Profile to start the simulation.
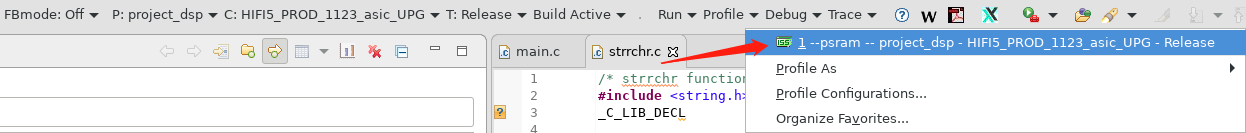
You can also click the settings button in the figure below to start the simulation. Note that you cannot directly click the profile button on the toolbar, otherwise there will be no memory latency model by default.
In the tab bar of the simulation window, there are various statistical results:

Note
If the following popup appears when starting the simulation, note that the prompt window for the Start with counting off option is incorrect (there is an extra “s” in command).
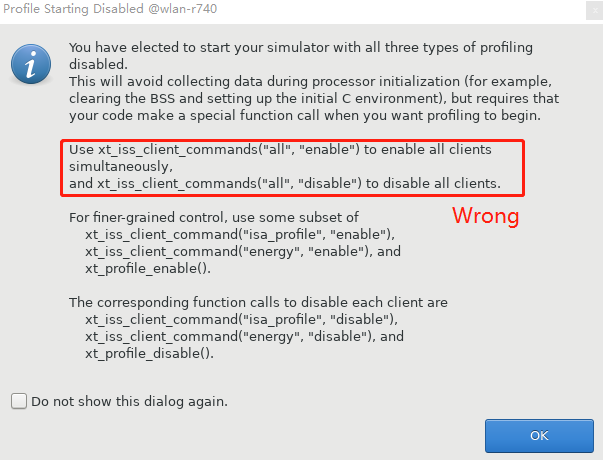
It should be:
xt_iss_client_command("all", "enable")
CMD Simulation
View simulation commands
After GUI simulation is completed, you can click the Console below to view Xplorer simulation commands, for example:
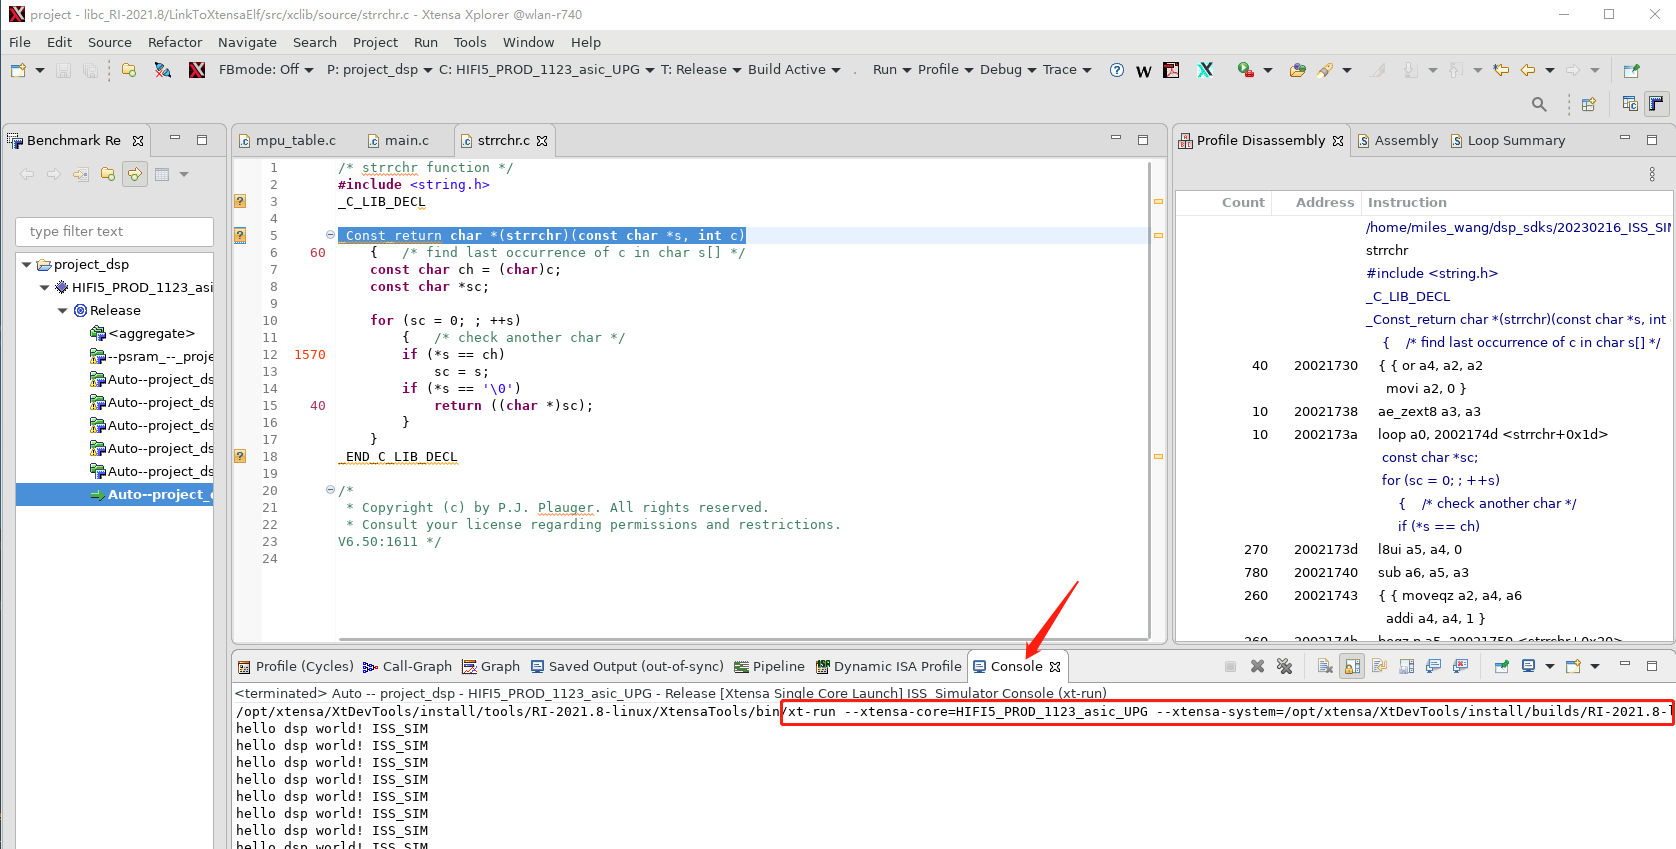
/opt/xtensa/XtDevTools/install/tools/RI-2021.8-linux/XtensaTools/bin/xt-run --xtensa-core=HIFI5_PROD_1123_asic_UPG --xtensa-system=/opt/xtensa/XtDevTools/install/builds/RI-2021.8-linux/HIFI5_PROD_1123_asic_UPG/config --xtensa-params= --console --mem_model --wbsize=32 --mlatency=28 --blockrepeat=8 --write_delay=28 --write_repeat=8 --summary --client=<dsp sdk>/project/project_dsp/bin/HIFI5_PROD_1123_asic_UPG/Release/_gen_d/profile/--psram_--_project_dsp_-_HIFI5_PROD_1123_asic_UPG_-_Release/p_10/iss.clientcmds --vector=1 --alt_reset_vec=0x60301000 <dsp sdk>/project/project_dsp/bin/HIFI5_PROD_1123_asic_UPG/Release/project_dsp
Modify commands
Users need to make adjustments according to actual project configuration and file paths. If using the
auto_build.shscript to compile project_dsp under Linux, you need to modify the xt-run command according to the actual situation. For example,auto_build.shwill copy the project to the<dsp sdk>/auto_wsdirectory for compilation, then the last parameter of the CMD (/home/miles_wang/dsp_sdks/20230216_ISS_SIM/dsp/project/project_dsp/bin/HIFI5_PROD_1123_asic_UPG/Release/project_dsp) needs to be modified to the actual location of the ELF file.Run commands
Simply run the above command in the terminal.
Profile and FreeRTOS Task Issues
Currently, the profiling method provided by Xplorer is not yet mature in handling exceptions and interrupt function calls. General algorithm optimization can also be performed independently of the FreeRTOS system. Therefore, we strongly do not recommend profiling under the FreeRTOS system.
If users must profile within a FreeRTOS Task environment:
Prevent context switching and handle interrupt service routines during profiling.
Complete a lazy switch before entering the statistics area. Because FreeRTOS task switching does not change coprocessor registers; coprocessor register exceptions are generated only when tasks use these DSP registers.
For example:
void profiling_task(void)
{
int start, end;
vTaskEnterCritical();
co_processor_func(test_array); // this function uses DSP co-processor registers start = xthal_get_ccount();
xt_iss_client_command("isa_profile", "enable");
xt_profile_enable();
for (int i = 0; i < 1000; ++i) {
co_processor_func (test_array);
}
xt_profile_disable ();
end = xthal_get_ccount();
vTaskExitCritical();
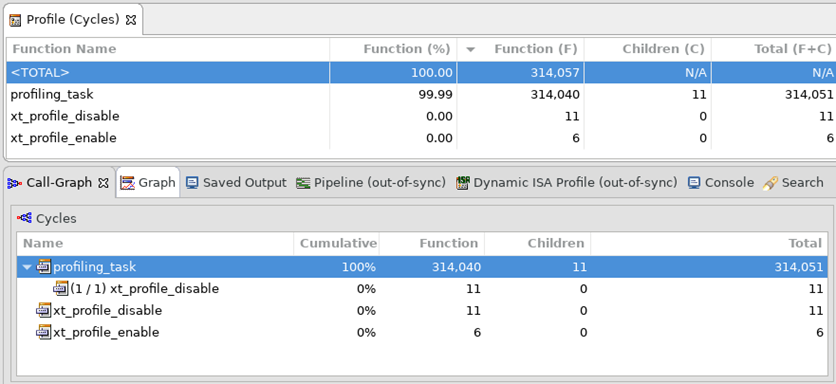
printf("%d cycles\n", end-start); // output: 314313 cycles
exit(1);
}
The profile result is as follows:
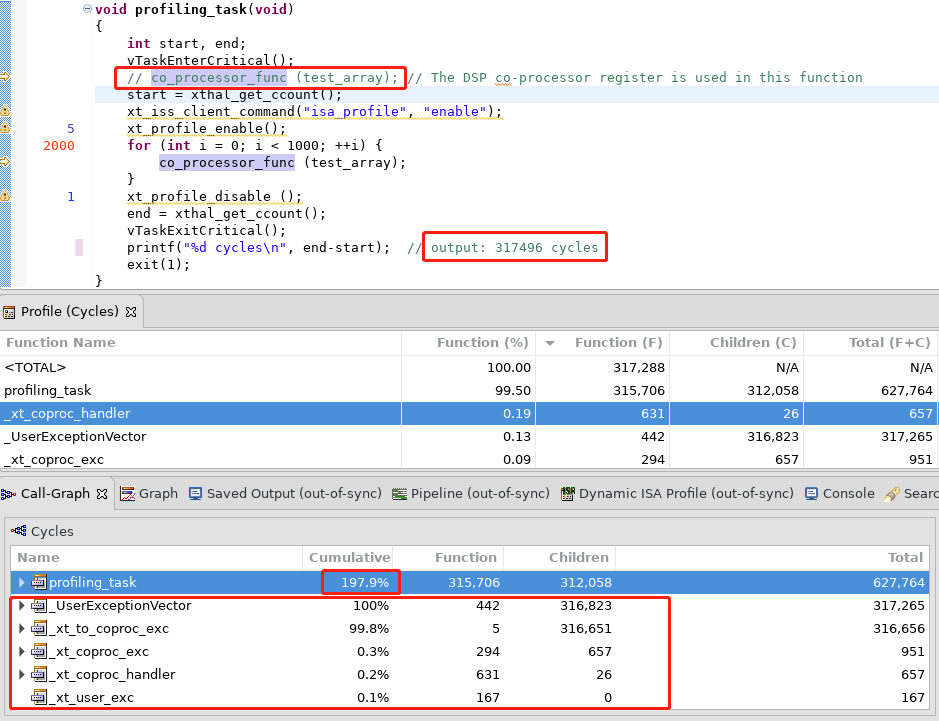
If you cancel the first call to co_processor_func(), you will find that some exception handlers appear, and Xplorer’s statistics for these handlers will be incorrect: the Profile (Cycles) table statistics are correct, but the Call-Graph table will have statistical errors.
Reference Documentation
For specific ISS simulation methods and profile result analysis, please refer to Xtensa Documentation.