Zephyr Quick Start
DTS Quick Start
For detailed DTS introduction, please refer to DTS Introduction
DTS Syntax and Usage Overview
For a quick start, please refer to DTS Basic Syntax and A Real Hardware Example
Modifying DTS Configuration
In Zephyr, DTS is distributed across multiple files. For details, see DTS Organization in Zephyr. Which file to modify depends on the situation.
Go to the corresponding test/sample source directory (tests are usually in
zephyr/tests/*/boards, samples are usually inzephyr/samples/*/boards) and add (if not present) the overlay file for the corresponding board and modify it.The following overlay example adds an LED node, sets the relevant GPIO port, and creates an alias
led0for the node:
/ {
  aliases {
    led0 = &led_0;
  };

  gpio-led {
    compatible = "gpio-leds";
    led_0: led_0 {
      gpios = <&gpioa 25 0>;
    };
  };
};
The following example modifies existing DTS configuration (changing
statustookay)
&gpioa {
  status = "okay";
};
Add an overlay file in the corresponding board-level dts directory. File naming rule:
<origin_board_dts_basename>_<revision>.overlay, whererevisionsupports multiple formats.Modify
revision.cmakein the same directory (create if not present) and specify the corresponding overlay file through theDEFAULT_REVISIONparameter.
board_check_revision(
    FORMAT LETTER
    DEFAULT_REVISION D  # <revision> is D
)

board_check_revision(
    FORMAT MAJOR.MINOR.PATCH
    DEFAULT_REVISION 2.0.0  # <revision> is 2.0.0
)

board_check_revision(
    FORMAT NUMBER
    DEFAULT_REVISION 2  # <revision> is 2
)
How to Verify Final DTS Configuration
Since Zephyr DTS involves multiple files, the same configuration item may be set or reset in multiple places, so looking at a single file cannot reflect the final result, such as:
Check if modifications (overlay) have taken effect
Check if a device’s status (
okayordisabled) or property settings meet expectations
In this case, you can check the build/zephyr/zephyr.dts file, which is the final generated DTS file.
How to Find a Device’s Binding File
For binding file introduction, please refer to DTS Binding
Find the compatible field of the device in the dts where it is defined, e.g.:
compatible = "realtek,ameba-rcc";Find a file named
realtek,ameba-rcc.yamland confirm that thecompatiblevalue in it is"realtek,ameba-rcc", then this file is the corresponding binding file.
Attention
This method only works if the binding file naming follows the same convention as the compatible field. However, this rule is not mandatory in Zephyr. If inconsistent, use Method 2.
Locate the
devicetree_generated.hfile and find the complete node name of the desired device at the beginning of the file, e.g.,/soc/gpio@41010000
* Node dependency ordering (ordinal and path):
*   0   /
*   1   /aliases
*   2   /chosen
*   3   /soc
*   4   /soc/interrupt-controller@e000e100
*   5   /soc/gpio@41010000
*   6   /buttons
*   7   /buttons/button_0
*   8   /clocks
*   9   /clocks/clk_sys
*   10  /cpus
Continue searching in the file for
Devicetree node: /soc/gpio@41010000to find the following location:
/*
* Devicetree node: /soc/gpio@41010000
*
* Node identifier: DT_N_S_soc_S_gpio_41010000
*
* Binding (compatible = realtek,ameba-gpio):
*   $ZEPHYR_BASE/dts/bindings/gpio/realtek,ameba-gpio.yaml
*
* (Descriptions have moved to the Devicetree Bindings Index
* in the documentation.)
*/
Line 7 contains the full path to the binding file used by the device
How to Access DTS in Code
Accessing DTS is usually done to get properties or drivers of a node. Follow these steps:
Suppose you have the following DTS content:
/ {
    soc {
        serial0: serial@40002000 {
            reg = <0x40002000 0x100>;
            status = "okay";
            current-speed = <115200>;
            /* ... */
        };
    };

    aliases {
        my-serial = &serial0;
    };

    chosen {
        zephyr,console = &serial0;
    };
};
First, get a node identifier. There are multiple ways to identify a node in DTS, so there are corresponding methods to get node identifiers:
/* Option 1: by node label */
#define MY_SERIAL DT_NODELABEL(serial0)

/* Option 2: by alias */
#define MY_SERIAL DT_ALIAS(my_serial)

/* Option 3: by chosen node */
#define MY_SERIAL DT_CHOSEN(zephyr_console)

/* Option 4: by path */
#define MY_SERIAL DT_PATH(soc, serial_40002000)
In the above code, the macro
MY_SERIALrepresents the node identifier. You can use it to further get node properties or drivers.
/* Demo 1: conditional compilation based on node status */
#if DT_NODE_HAS_STATUS(MY_SERIAL, okay)
//Desired code when node is okay(enabled)
#endif

/* Demo 2: get normal property */
uint32_t speed = DT_PROP(MY_SERIAL, current_speed);  //=115200

/* NOTE: some properties have an exclusive macro */
/* Demo 3: get reg info */
uint32_t addr = DT_REG_ADDR(MY_SERIAL);  //=0x40002000
uint32_t size = DT_REG_SIZE(MY_SERIAL);  //=0x100
const struct device *const dev = DEVICE_DT_GET(MY_SERIAL);

if (!device_is_ready(dev)) {
    /* Not ready, do not use */
    return -ENODEV;
}
uart_poll_out(dev, 'a');
For more advanced usage, refer to Extended Reading
How to Access DTS in Kconfig
Refer to: Kconfig Quick Start
How to Access DTS in CMake
Refer to: CMake Quick Start
How to Locate undefined reference DTS Symbol Issues
Nodes defined in DTS are defined as symbols in driver code with identifiers generated according to certain encoding rules, such as
__device_dts_ord_22In practice, you may encounter compilation errors like the following:
/opt/rtk-toolchain/asdk-12.3.1-4431/linux/newlib/bin/../lib/gcc/arm-none-eabi/12.3.1/../../../../arm-none-eabi/bin/ld.bfd: app/libapp.a(test_counter.c.obj):(.rodata.devices+0x0): undefined reference to `__device_dts_ord_22'
The cause of this problem is usually that code above the driver layer references a symbol (driver instance), but the symbol definition (code implementation) of the driver instance is not found during linking
You cannot directly locate the relevant code area through the name
__device_dts_ord_22. Here is a troubleshooting process for the above error
First, locate the problematic DTS node: Through
test_counter.c.obj, you can determine that the source file referencing this symbol istest_counter.c. At this point, you can choose to directly view the file. There are two situations:If only one driver instance is referenced, you can determine the corresponding DTS node information (node name, label, etc.) through the code. For example, there might be code like:
#define I2C_DEV_NODE DT_ALIAS(i2c_0)
const struct device *const i2c_dev = DEVICE_DT_GET(I2C_DEV_NODE);
At this point, you can easily determine that there is a problem with the driver definition for the device corresponding to the
i2c_0DTS nodeIf the code is complex, with multiple driver instance references or complex preprocessing logic, you can directly pinpoint the DTS node by generating a preprocessed file. Steps are as follows:
Find
test_counter.c.objin the filebuild/compile_commands.jsonto locate a position like this (some xxx content omitted):{ "directory": "/xxx/build", "command": "/xxx/arm-none-eabi-gcc xxx -o CMakeFiles/app.dir/src/test_counter.c.obj -c /xxx/zephyr/tests/drivers/counter/counter_basic_api/src/test_counter.c", "file": "/xxx/zephyr/tests/drivers/counter/counter_basic_api/src/test_counter.c", "output": "CMakeFiles/app.dir/src/test_counter.c.obj" },
The
commandfield is the complete command for compilingtest_counter.c. You need to slightly modify the complete command: change-ooutput path,-cto-E, then execute in terminal:/xxx/arm-none-eabi-gcc xxx -o test_counter.i -E /xxx/zephyr/tests/drivers/counter/counter_basic_api/src/test_counter.c",
A file
test_counter.iwill be generated in the execution directory. Open the file and search for the undefined symbol__device_dts_ord_22to find the following content:static const struct device *const devices[] = { # 63 "/xxx/zephyr/tests/drivers/counter/counter_basic_api/src/test_counter.c" # 124 "/xxx/zephyr/tests/drivers/counter/counter_basic_api/src/test_counter.c" (&__device_dts_ord_22), (&__device_dts_ord_23), (&__device_dts_ord_24), (&__device_dts_ord_25), # 144 "/xxx/zephyr/tests/drivers/counter/counter_basic_api/src/test_counter.c" };
From lines 4 and 5 above, we can see that
__device_dts_ord_22is referenced in line 124 of the source file. Locate that line of code:#ifdef CONFIG_COUNTER_TMR_AMEBA DEVS_FOR_DT_COMPAT(realtek_ameba_counter) #endif
From this, we know that there is a problem with the driver definition for the device corresponding to the DTS node with
compatibleasrealtek,ameba-counter
Troubleshoot the driver definition issue for the DTS node. You can refer to the following ideas:
DTS node does not exist or is not enabled (
statusnot set tookay), refer to How to Verify Final DTS ConfigurationDTS node’s corresponding driver code is not included in compilation. Check the relevant driver’s
CMakeLists.txtor Kconfig configurationCoding issues in the DTS node driver code, such as whether the
DT_DRV_COMPATmacro definition is correct, etc.
Kconfig Quick Start
Getting DTS Information in Kconfig
Zephyr provides a series of interfaces to support accessing DTS information in Kconfig: Devicetree-related Functions.
Here are some usage examples:
config AMEBA_PSRAM
  def_bool y if $(dt_nodelabel_enabled,psram)  # init bool value by node state

config AMEBA_PSRAM_SIZE
  hex
  depends on AMEBA_PSRAM
  default $(dt_nodelabel_reg_size_hex,psram)  # init hex value by node reg's size cell
Corresponding DTS:
psram: memory@60000000 {
  compatible = "zephyr,memory-region";
  device_type = "memory";
  reg = <0x60000000 DT_SIZE_M(4)>;   /* dt_nodelabel_reg_size_hex reads size from here */
  zephyr,memory-region = "PSRAM";
  status = "disabled";               /* dt_nodelabel_enabled reads status from here */
};
CMake Quick Start
Getting DTS Information in CMake
Zephyr provides a series of interfaces to access DTS information in CMake. The function implementation can be found in: zephyr/cmake/modules/extensions.cmake
Here are some API descriptions:
API |
Description |
|---|---|
|
Function for retrieving the node path for the node having nodelabel |
|
Get a node path for an /aliases node property |
|
Tests whether a node with path <path> exists in the devicetree |
|
Tests whether <path> refers to a node which exists in the devicetree, and has a status property matching the <status> argument |
|
Get a devicetree property value. The value will be returned in the <var> parameter |
|
Get a list of paths for the nodes with the given compatible. The value will be returned in the <var> parameter |
|
Get the number of register blocks in the node’s reg property |
|
Get the base address of the register block at index <idx>, or with name <name> |
|
Get the size of the register block at index <idx>, or with name <name> |
|
Test if the devicetree’s /chosen node has a given property <prop> which contains the path to a node |
|
Get a node path for a /chosen node property |
NVIC Quick Start
For detailed NVIC introduction, please refer to NVIC Introduction
Zephyr Interrupt Usage Guide
Developing drivers in Zephyr that use interrupts requires completing several key steps to properly respond to interrupts.
Below is a usage example with key steps listed.
Code Example
DTS configuration:
Interrupt device tree configuration example1nvic: interrupt-controller@e000e100 { 2 #address-cells = < 0x1 >; 3 compatible = "arm,v8.1m-nvic"; 4 reg = < 0xe000e100 0xc00 >; 5 interrupt-controller; 6 #interrupt-cells = < 0x2 >; 7 arm,num-irq-priority-bits = < 0x3 >; 8 phandle = < 0x1 >; 9}; 10timer0: counter@40819000 { 11 compatible = "realtek,ameba-counter"; 12 reg = <0x40819000 0x30>; 13 clocks = <&rcc AMEBA_LTIM0_CLK>; 14 interrupts = <7 0>; 15 clock-frequency = <32768>; 16 status = "disabled"; 17};
C code implementation:
Interrupt driver code implementation example1#define DT_DRV_COMPAT realtek_ameba_counter 2... 3 4void counter_ameba_isr(const struct device *dev) 5{ 6} 7 8#define TIMER_IRQ_CONFIG(n) \ 9 static void irq_config_##n(const struct device *dev) \ 10 { \ 11 IRQ_CONNECT(DT_INST_IRQN(n), DT_INST_IRQ(n, priority), counter_ameba_isr, \ 12 DEVICE_DT_INST_GET(n), 0); \ 13 irq_enable(DT_INST_IRQN(n)); \ 14 } 15 16#define AMEBA_COUNTER_INIT(n) \ 17 TIMER_IRQ_CONFIG(n) \ 18 ... 19 20DT_INST_FOREACH_STATUS_OKAY(AMEBA_COUNTER_INIT);
Key Steps
Confirm hardware support and configure interrupt information in DTS.
As shown in the highlighted line 14 of Interrupt device tree configuration example above, set the interrupt property of the driver. The
interruptsproperty has two parameters: the first is the interrupt number, and the second is the interrupt priority.Implement the interrupt service function in driver code, which is needed when registering interrupts, as shown in lines 4-6 of Interrupt driver code implementation example above.
In driver code, get interrupt priority and other properties from DTS, which are needed when registering interrupts, as shown in line 11 of Interrupt driver code implementation example above. For detailed introduction, please refer to Getting Interrupt Properties.
/* Get interrupt number */
DT_INST_IRQN(n);
/* Get interrupt priority */
DT_INST_IRQ(n, priority);
Register interrupt in driver code, as shown in line 11 of Interrupt driver code implementation example above. For detailed introduction, please refer to Interrupt Registration.
Enable interrupt in driver code, as shown in line 13 of Interrupt driver code implementation example above. For detailed introduction, please refer to Enable/Disable Interrupt.
File System Quick Start
For detailed file system introduction, please refer to File System Introduction
LittleFS on FLASH
Sample path: zephyr/samples/subsys/fs/littlefs/
Use the following command to build the LittleFS on FLASH sample (replace <BOARD> with your board name):
./nuwa.py build zephyr/samples/subsys/fs/littlefs -b <BOARD>
When custom DTS is needed, refer to LittleFS on FLASH Example for configuration.
You can verify the correctness of the DTS configuration through the final generated DTS file build/zephyr/zephyr.dts:
spic’s status = “okay”
The starting address and size of the partition used by LittleFS meet expectations
If you encounter link errors, some features may not be enabled.
You can check the final conf configuration through build/zephyr/include/generated/zephyr/autoconf.h.
LittleFS on FLASH requires the following configurations to be enabled in prj.conf:
CONFIG_FILE_SYSTEM=y
CONFIG_FILE_SYSTEM_LITTLEFS=y
CONFIG_FLASH=y
CONFIG_FLASH_MAP=y
FatFS on SD
Sample path: zephyr/samples/subsys/fs/fs_sample/
Use the following command to build the FatFS on SD sample (replace <BOARD> with your board name):
./nuwa.py build zephyr/samples/subsys/fs/fs_sample -b <BOARD>
If you encounter link errors, some features may not be enabled.
You can check the final conf configuration through build/zephyr/include/generated/zephyr/autoconf.h.
FatFS on SD requires the following configurations to be enabled in prj.conf:
CONFIG_FILE_SYSTEM=y
CONFIG_FAT_FILESYSTEM_ELM=y
CONFIG_DISK_ACCESS=y
CONFIG_DISK_DRIVERS=y
Settings Quick Start
For detailed Settings introduction, please refer to Settings Introduction
Sample path: zephyr/samples/subsys/settings/
Use the following command to build the Settings sample:
./nuwa.py build zephyr/samples/subsys/settings -b <BOARD>
For DTS configuration, please refer to Settings Configuration.
Debug Quick Start
For detailed Debug introduction, please refer to Debug Introduction
Debug Overview
Debug consists of two parts:
Offline debugging: Not directly connected to a running target. Analyze issues locally or in analysis tools by collecting offline data such as logs, coredump, trace data, and performance sampling files.
Online debugging: Debugging tools directly connect to a running target system (e.g., via JTAG/SWD, GDB remote, network/serial port) to perform operations such as breakpoints, single-stepping, variable viewing and modification, and register/memory access in a real environment.
Offline Debugging
The following introduces an offline debugging method for analyzing coredump logs.
Configuration
For detailed configuration instructions, please refer to coredump Configuration
Configuration example:
CONFIG_DEBUG_COREDUMP=y                 # Enable coredump module
CONFIG_DEBUG_COREDUMP_BACKEND_LOGGING=y # Use logging module to get coredump output
CONFIG_DEBUG_COREDUMP_MEMORY_DUMP_MIN=y # Only dump the stack of the exception thread, its thread structure, and some other minimal essential data
Getting coredump
For detailed dump content, please refer to Dump Format
Get coredump information from the device based on the enabled backend. For example, if the logging backend is enabled, you can save the printed logs using a logging tool to obtain the log file coredump.log.
Parsing
For detailed parsing instructions, please refer to Parsing Steps
Steps to parse coredump using the logging backend:
Run the coredump serial log converter to extract the coredump portion from coredump.log and generate coredump.bin:
./zephyr/scripts/coredump/coredump_serial_log_parser.py coredump.log coredump.bin
Start a custom GDB server to parse zephyr.elf and coredump.bin to obtain symbol tables and exception stack information for the gdb debugger to query:
./zephyr/scripts/coredump/coredump_gdbserver.py build/zephyr/zephyr.elf coredump.bin
Start the GDB debugger:
arm-none-eabi-gdb build/zephyr/zephyr.elf
Inside GDB, connect to the GDB server via port 1234:
(gdb) target remote localhost:1234
You can also start the GDB server from within GDB:
Start GDB:
arm-none-eabi-gdb build/zephyr/zephyr.elf
Inside GDB, start the GDB server with the
--pipeoption:(gdb) target remote | ./scripts/coredump/coredump_gdbserver.py --pipe build/zephyr/zephyr.elf coredump.bin
Then you can use gdb commands to view exception information, such as:
Check CPU registers:
info registersView backtrace:
bt
Online Debugging
For detailed online debugging instructions, please refer to Online Debugging
The following introduces a method for online debugging using gdb, which requires connecting the development board and computer via Jlink. Three typical scenarios are described.
Using gdb command line debugging:
Note
PA18 and PA19 cannot be occupied.
Code is on a Windows computer, development board is connected to the Windows computer via jlink, use
west debugfor debugging. Simply use thewest debugcommand on Windows:west debug
The output is as follows:
PS D:\code\nuwa> west debug
-- west debug: rebuilding
ninja: no work to do.
-- west debug: using runner jlink
-- runners.jlink: reset after flashing requested
-- runners.jlink: JLink version: 8.40
-- runners.jlink: J-Link GDB server running on port 2335; no thread info available
GNU gdb (Realtek ASDK-12.3.1 Build 4431) 12.1.90.20221114-git
Copyright (C) 2022 Free Software Foundation, Inc.
License GPLv3+: GNU GPL version 3 or later <http://gnu.org/licenses/gpl.html>
This is free software: you are free to change and redistribute it.
There is NO WARRANTY, to the extent permitted by law.
Type "show copying" and "show warranty" for details.
This GDB was configured as "--host=x86_64-w64-mingw32 --target=arm-none-eabi".
Type "show configuration" for configuration details.
For bug reporting instructions, please see:
<https://www.gnu.org/software/gdb/bugs/>.
Find the GDB manual and other documentation resources online at:
    <http://www.gnu.org/software/gdb/documentation/>.

For help, type "help".
Type "apropos word" to search for commands related to "word"...
Reading symbols from D:\code\nuwa\build\zephyr\zephyr.elf...
Remote debugging using :2335
__enable_irq () at D:/code/nuwa/modules/hal/cmsis_6/CMSIS/Core/Include/cmsis_gcc.h:800
800       __ASM volatile ("cpsie i" : : : "memory");
Resetting target
(gdb)
Code is on a Linux server, development board is connected to a Windows computer via jlink, use gdb command line tool for debugging.
Manually start JLinkGDBServer on Windows to connect to the development board;
You can use
sdk/amebagreen2_gcc_project/utils/jlink_script/ap_jlinkGDBSever.batto start JLinkGDBServer. The script already has some configurations and can directly connect to the AP core. Double-click the script to start it.Note
The
ap_jlinkGDBSever.batscript uses-device Cortex-M33by default. Since rtl8721f uses a Cortex-M55 core, you need to change this to-device Cortex-M55before running the script, or usewest debuginstead which picks up the correct CPU type automatically fromboard.cmake.Start the gdb debugger on the Linux server to connect to JLinkGDBServer.
~/code/nuwa$ arm-none-eabi-gdb build/zephyr/zephyr.elf
(gdb) target remote <windows-ip>:2335
Code is on a Linux server, development board is connected to a Windows computer via jlink, use
west debugcommand line for debugging.First start JLinkRemoteServer on Windows;
Double-click the JLinkRemoteServer software to start it. You need to select a port for listening to connections from JLinkGDBServer on the Linux server.
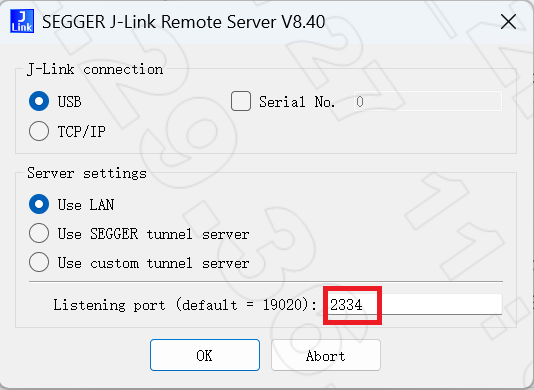
Use the
west debugcommand on the Linux server. You need to add an-i ip:portparameter to connect to JLinkRemoteServer on Windows. The port must be the same as set in step A.west debug -i ip:port
MCUboot Quick Start
For detailed MCUboot introduction, please refer to MCUboot Introduction
Building MCUboot Examples
This section uses zephyr/samples/sysbuild/with_mcuboot as an example. It is a minimal project with MCUboot enabled and contains only the necessary configurations.
Build, execute the command:
./nuwa.py build -b rtl872xda_evb//mcuboot zephyr/samples/sysbuild/with_mcuboot --sysbuild
The firmware is located in the
images/directory under the SDK root. For flashing, refer to Firmware Download.Use Trace Tool to view the serial log. The following log indicates that both the
km0andkm4CPUs are running successfully:[MAIN-I] KM0 OS START *** Booting Zephyr OS build f998faa02fe0 *** Hello sysbuild with mcuboot! rtl872xda_evb
Build, execute the command:
./nuwa.py build -b rtl8730e_evb//mcuboot zephyr/samples/sysbuild/with_mcuboot --sysbuild
The firmware is located in the
images/directory under the SDK root. For flashing, refer to Firmware Download.Use Trace Tool to view the serial log. The following log indicates that the
km0,km4andca32CPUs are all running successfully:[MAIN-I] KM0 OS START [MAIN-I] KM4 MAIN [MAIN-I] KM4 START SCHEDULER *** Booting Zephyr OS build f998faa02fe0 *** Hello sysbuild with mcuboot! rtl8730e_evb
Build:
./nuwa.py build -b rtl8721f_evb//mcuboot zephyr/samples/sysbuild/with_mcuboot --sysbuild
The firmware is located in the
images/directory under the SDK root. For flashing, refer to Firmware Download.Use Trace Tool to view the serial log. The following log indicates that both the
km4nsandkm4tzCPUs are running successfully:[MAIN-I] NP OS START *** Booting Zephyr OS build f998faa02fe0 *** Hello sysbuild with mcuboot! rtl8721f_evb
Note
When downloading firmware via ImageTool, the Start Addr and End Addr of each firmware must be consistent with the flash layout configuration in DTS. For the address calculation method, see Flash Layout.
Creating Your Own Application
Copy the example directory above to a custom location (referred to as <APP_DIR>), modify it as needed, and build it, replacing the project path in the build command with this <APP_DIR>.
When building with sysbuild, two configuration files can be used to adjust MCUboot-related configuration:
<APP_DIR>/sysbuild.conf: sysbuild (system-level) configuration for settingSB_CONFIG_*options. For example, to select the OTA upgrade mode (the top level defaults to swap_using_move when not specified; you can also select swap_using_offset or another mode):SB_CONFIG_MCUBOOT_MODE_SWAP_USING_OFFSET=y
<APP_DIR>/sysbuild/mcuboot.conf: a Kconfig fragment that applies only to the MCUboot bootloader firmware. It is merged after the board-level configuration (zephyr/boards/realtek/<board>/<board>_mcuboot_defconfig, etc.) and can override its defaults.
Firmware Signing
Before booting an app, MCUboot verifies its signature and refuses to boot if verification fails. The signature is appended to the end of the firmware as a TLV, and the bootloader embeds the corresponding public key for verification. The Ameba platform supports two sources of signing keys.
Signing with MCUboot’s Built-in Keys
This is the default Zephyr/MCUboot approach. The signature algorithm and key file are selected via sysbuild configuration:
Signature algorithm:
SB_CONFIG_BOOT_SIGNATURE_TYPE_RSA/SB_CONFIG_BOOT_SIGNATURE_TYPE_ECDSA_P256/SB_CONFIG_BOOT_SIGNATURE_TYPE_ED25519(defaults to RSA).Key file:
SB_CONFIG_BOOT_SIGNATURE_KEY_FILEspecifies the signing private key (PEM). If not specified, MCUboot’s sample key (such asroot-ec-p256.pem) is used; these are for development only and must be replaced with your own keys in production.
Signing with Keys in manifest.json5
Ameba ROM signs the bootloader (secure boot) with the keys in manifest.json5. For easier maintenance, the MCUboot signing of the app can reuse the same set of keys (only ECDSA_P256 and ED25519 are supported). The steps are as follows:
Add to
<APP_DIR>/sysbuild/mcuboot.conf:CONFIG_AMEBA_USING_MANIFEST_KEY=yAdd to
<APP_DIR>/sysbuild.conf:SB_CONFIG_BOOT_SIGNATURE_KEY_FILE="\${APP_DIR}/my.key"Update your keys in
manifest.json5Execute the build. cmake automatically converts the app (image2) key in
manifest.json5to the PEM format required by MCUboot according to the selected algorithm, and writes it to the$APP_DIR/my.keyspecified above for signing.
Firmware Encryption
The Ameba platform supports two independent firmware encryption methods.
Using MCUboot’s Built-in Encryption
This is MCUboot’s encrypted images feature, mainly used to encrypt OTA upgrade firmware: the firmware payload is encrypted with AES-CTR, and the AES key is wrapped with an asymmetric algorithm (one of ECIES-P256, ECIES-X25519, RSA-OAEP, or AES-KW) and delivered together with the firmware; the device decrypts it while moving/upgrading the image. It applies only to upgrade modes that move the image, such as swap and overwrite-only (direct-XIP is not supported).
Enabled via
SB_CONFIG_BOOT_ENCRYPTION.SB_CONFIG_BOOT_ENCRYPTION_KEY_FILEspecifies the encryption key (PEM), andSB_CONFIG_BOOT_ENCRYPTION_ALG_AES_128/SB_CONFIG_BOOT_ENCRYPTION_ALG_AES_256select the AES key length.When enabled, the build additionally produces the encrypted firmware
zephyr.signed.encrypted.bin.
Using RSIP Encryption
RSIP is Ameba’s hardware flash encryption: firmware is programmed into flash as ciphertext and decrypted on the fly by hardware on the bus at runtime, so no decryption into RAM is needed in the XIP case. For a detailed introduction and configuration steps, refer to
Secure Firmware Protection (RSIP)
. The related configuration is in manifest.json5 (modules/hal/realtek/ameba/<SOC_NAME>/manifest.json5), where you set rsip_enable, the encryption mode (XTS/CTR), the keys, etc.; at build time its IV is appended to the firmware as a custom TLV.
Twister Quick Start
For detailed Twister introduction, please refer to Twister Introduction.
The basic steps to run Twister are as follows:
Refer to Twister Environment Setup to prepare the environment.
Make sure the board can enter flash mode, so that Twister can automatically flash firmware between test rounds:
Boards that support entering flash mode via hardware need no extra configuration.
Other boards need a firmware that supports the
reboot uartburncommand (configured withCONFIG_SHELL=y) flashed in advance; Twister uses this command to put the board into flash mode.
You can first verify the command by manually entering
reboot uartburnin tracetool ; you should see the following echo:uart:~$ reboot uartburn [BOOT-I] ROM:[V1.0] [BOOT-I] FLASH RATE:1, Pinmux:0 [BOOT-I] BOOT FROM NOR Flash Download StartFrom the nuwa workspace root, run a basic kernel test suite to verify that the Twister build and flash process is correct. For example:
Linux (Ubuntu):./nuwa.py twister --device-testing \ --flash-before --west-flash="--port=/dev/ttyUSB0" --device-serial /dev/ttyUSB0 --device-serial-baud 1500000 \ --platform rtl8721f_evb \ -T zephyr/tests/kernel/threads/dynamic_thread_stack/ \ --test kernel.threads.dynamic_thread.stack.no_pool.no_alloc.no_user
Windows:python nuwa.py twister --short-build-path --device-testing ` --flash-before --west-flash="--port=COM12" --device-serial COM12 --device-serial-baud 1500000 ` --platform rtl8721f_evb ` -T zephyr/tests/kernel/threads/dynamic_thread_stack/ ` --test kernel.threads.dynamic_thread.stack.no_pool.no_alloc.no_user
Note
Replace the serial ports specified by
--west-flashand--device-serial, and the platform specified by--platformin the above command according to your actual situation.In the output interface, expect to see the following passed information:
INFO    - Total complete:    1/   1  100%  built (not run):    0, filtered:    0, failed:    0, error:    0
INFO    - 1 test scenarios (1 configurations) selected, 0 configurations filtered (0 by static filter, 0 at runtime).
INFO    - 1 of 1 executed test configurations passed (100.00%), 0 built (not run), 0 failed, 0 errored, with no warnings in 394.83 seconds.
INFO    - 1 of 1 executed test cases passed (100.00%) on 1 out of total 1118 platforms (0.09%).
INFO    - 3 selected test cases not executed: 3 skipped.
INFO    - 1 test configurations executed on platforms, 0 test configurations were only built.

Hardware distribution summary:

| Board                 | ID   |   Counter |   Failures |
|-----------------------|------|-----------|------------|
| rtl8721f_evb/rtl8721f |      |         1 |          0 |
INFO    - Saving reports...
......
If you encounter errors, you can refer to Twister Test Failure Diagnosis.
After passing the above steps, you can consider that the basic process of Twister has been established. Next, you can further run user-specified test cases.
For how to select the range of test cases via command-line parameters, see Twister Usage.
For how to run a custom batch test suite, see Custom Batch Test Suite.