Remote Features
If your local machine is a Windows system and the development board is connected to it, but you choose to put the SDK on a Linux server and develop through the VS Code Remote-SSH extension, follow these steps:
Download AmebaRemoteService on your local machine and run it. By default it starts without a password; if security is a concern, you can set one.
In VS Code, press
F1, typeameba: Manage Remote Servers, and click the corresponding option.Click the
Add New Remote Serveroption.
- Server Name:
Enter a custom name for the server. It must not duplicate an existing server name.
- Server Address:
Enter the IPv4 address of your local Windows machine. The same address cannot be added twice.
- Server Password:
If a password is configured in the Windows
AmebaRemoteServicesoftware, enter it here. Otherwise, press Enter to skip.
After successful configuration, the serial port list is updated with the remote serial ports, and remote ports are prefixed with
R:/: when only one remote server provides serial ports they are shown asR:/COM3; when several do, they are shown asR:/<server IP>/COM3to tell the sources apart.Pressing
F1again in VS Code and enteringameba: Manage Remote Serverslets you view the existing servers. You can click an existing server to delete it.
Remote Serial Port Flashing
Select the target chip and target remote serial port.
Set the flashing parameters as described in Optional Plugin Settings (Flash).
Click the Flash button to start the firmware flashing process.
Real-time flashing progress and detailed logs are provided.
Remote Serial Port Monitoring
Select the target remote serial port.
Set the monitoring parameters as described in Optional Plugin Settings (Monitor).
Click the Monitor button to open the integrated serial monitor. It automatically selects the baud rate and connects to the serial port.
Display and receive serial data in real time.
The monitoring features are the same as local monitoring.
Remote Debugging
The remote debugging framework is illustrated as follows:
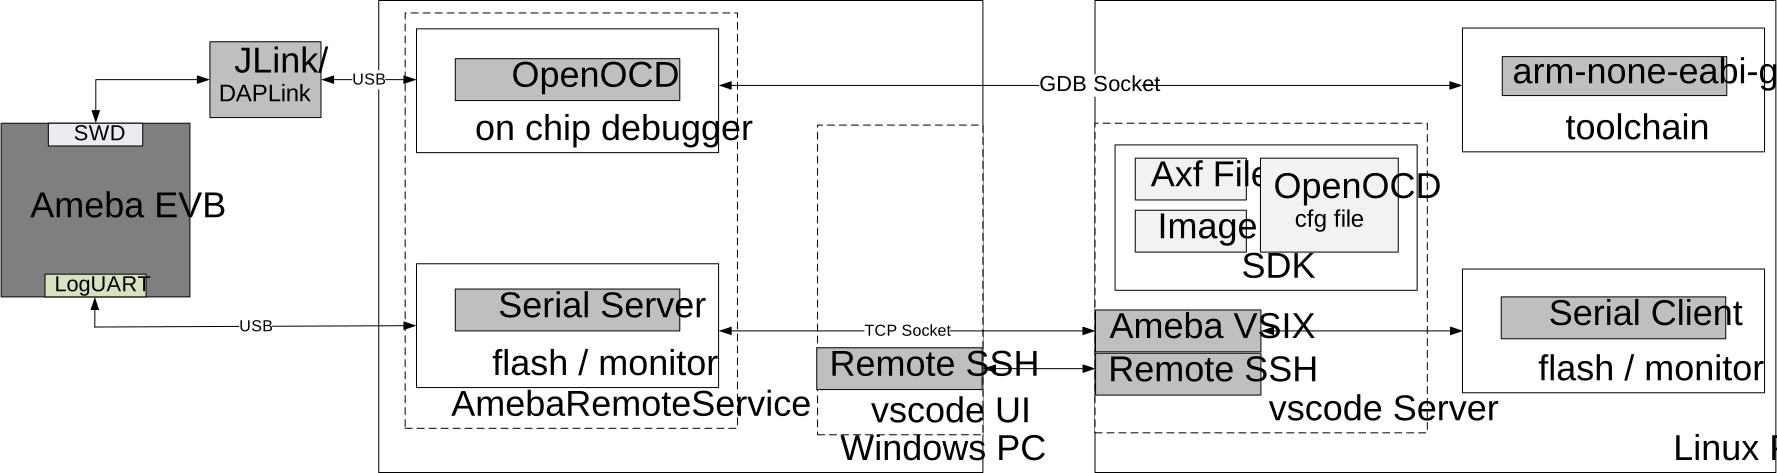
The target chip is connected to the local Windows PC via a debug adapter.
VS Code installed on the Windows PC connects to the remote server via SSH.
When debugging starts, OpenOCD (GDB server) is launched on the local Windows PC by AmebaRemoteService. You can view the OpenOCD output logs and status in the AmebaRemoteService window.
The toolchain’s built-in GDB, deployed on the remote server, connects to the locally launched OpenOCD, after which debugging operations can proceed.
Steps to start debugging:
Complete the hardware connections and basic configuration as required in Code Debugging.
In the extension, select the target chip for debugging and the remote serial port.
Click the Debug button to launch the integrated debugger.
Start code debugging; the debugging tips are the same as described in Code Debugging.